


Mission Plan #2: Formulating Your Axe List
Mission Plan Series #2

moontower.ai has released a new series —> The Moontower Mission Plan
This guides a step-by-step progression for developing opinions on volatility which you can use whether you are trading options to bet on volatility itself, or more likely, to bet on direction.
An installment will be released once a week right here on substack.
If you want to access the entire Plan now, you can become a free member here.
Recall from the introduction:
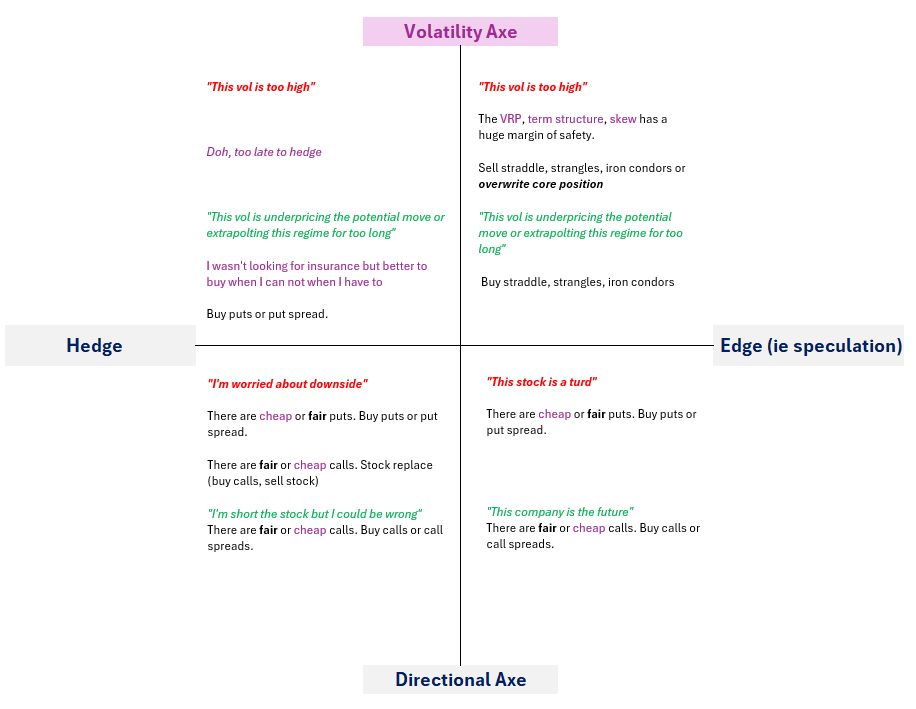
Option trades have 3 possible motivations:
Directional speculation
Directional hedge
Driven by volatility mispricings themselves (directionally agnostic attitude)
When you trade for directional reasons the motivation comes from some mix of your own research or preference.
If you are bullish on a stock, well, you just buy the stock.
If you’re bullish on a stock and want to trade options you’ll most likely buy calls. However price of an option is influenced by more than just direction (ie delta). You need to wonder if the call you choose is a good value because unlike the stock itself, the price depends on the consensus of volatility, not whether the stock will go up.
The moment you consider options to express your bet you have passed through a gate. Your decision is no longer just about the stock’s direction but how attractive this derivative on this stock is!
Regardless of your motivation to trade options, you need an opinion (ie an axe) on volatility.
Developing A Volatility Axe
We say moontower.ai is option analytics with a “point of view” because it reduces the option landscape into buckets of expensive, cheap, and fair with a cross-sectional (ie relative value) lens.
Whether we want to sell covered calls/cash-secured puts (trade ideas rooted in volatility) or trade outright options or vertical spreads (directional idea), we want to know if the options are relatively cheap or expensive.
Note
👓Seeing the present clearly
The Moontower ethos is “measurement not prediction”. The role of dashboards is to transform market data into information that can be compared on an apples-to-apples basis so aberrations “stick out”. Whether the aberration is justified or not depends on an investor’s judgment. Even a purely systematic strategy requires discretion — after all, the choice to standardize data according to an additional dimension is a judgment.
In the realm of fundamental investing, looking only at P/E ratio can cause an investor to overlook fast-growing companies that appear to be unprofitable because their net earnings are reduced by large cap-ex budgets. AMZN looked like it made no money during its rapid growth leading many investors to call it a bubble.
Discretionary and systematic traders both had a chance to see or not see the opportunity depending on what information they incorporated into their processes. Either way, “seeing the present clearly” is a prerequisite for making investments even if their outcomes depend on how the future unfolds.
The step-by-step approach
We will step through the moontower.ai tools in succession to filter option markets. This is a detailed tour of the funnel approach first introduced in the Primer.
In general:
We distill the broad universe of names into a short list
We refine the short list even further using drilldown tools
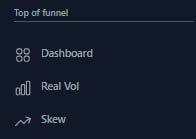
We step through the following top-of-funnel tools in order:
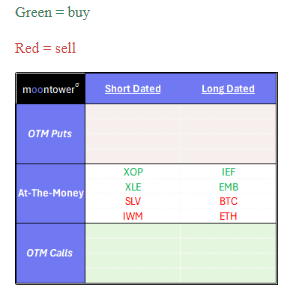
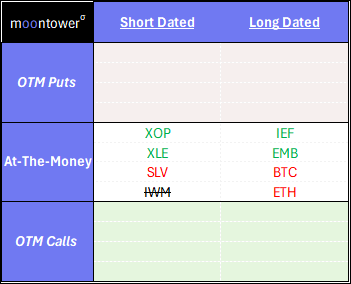
In the process, we fill out an Axe List worksheet that looks like this:
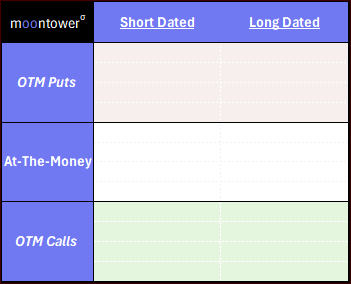
It will make sense once we get going…
1) Dashboard
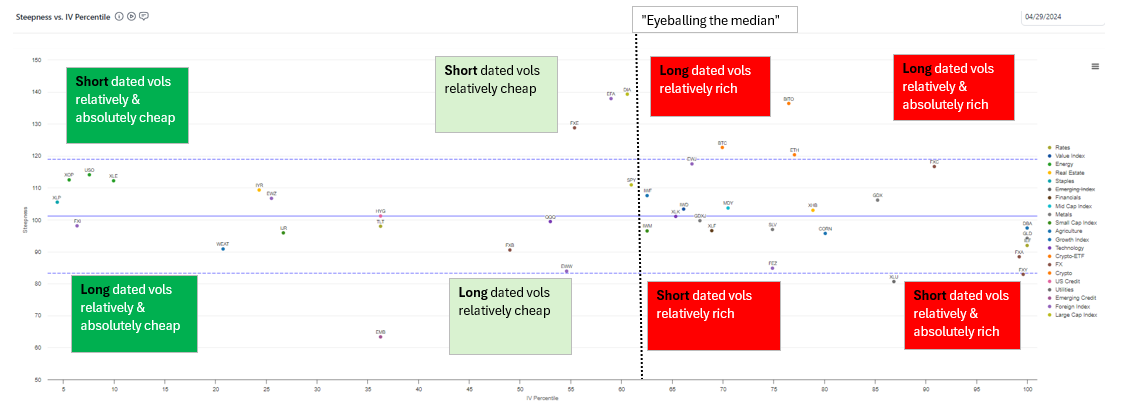
Recall from the Primer’s Top of the Funnel: Cross-Sectional Fair Value, the Dashboard can be thought of as 4 quadrants that loosely map to:
The Dashboard compares at-the-money (technically the .50 delta) options of the 1 and 6-month expiries with respect to what percentile implied volatility is in. In other words, is vol on the high or low end of its range and within that context is the short or longer dated option a better value?
You could even make finer distinctions between what is relatively and absolutely cheap or expensive:
Filling out the Axe List
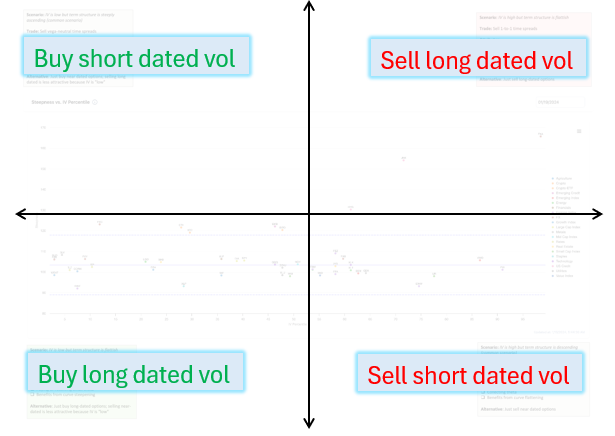
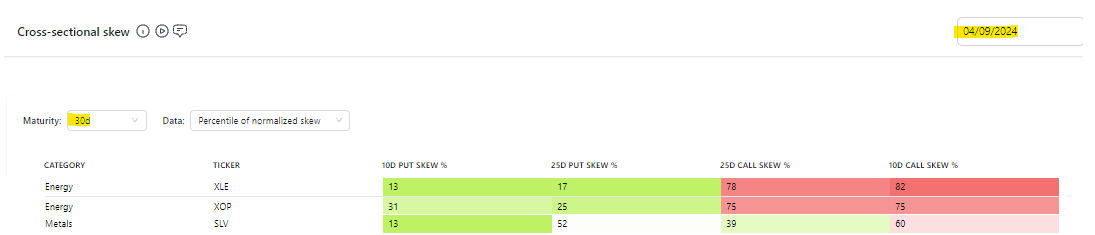
Consider the Dashboard from 4/9/2024:
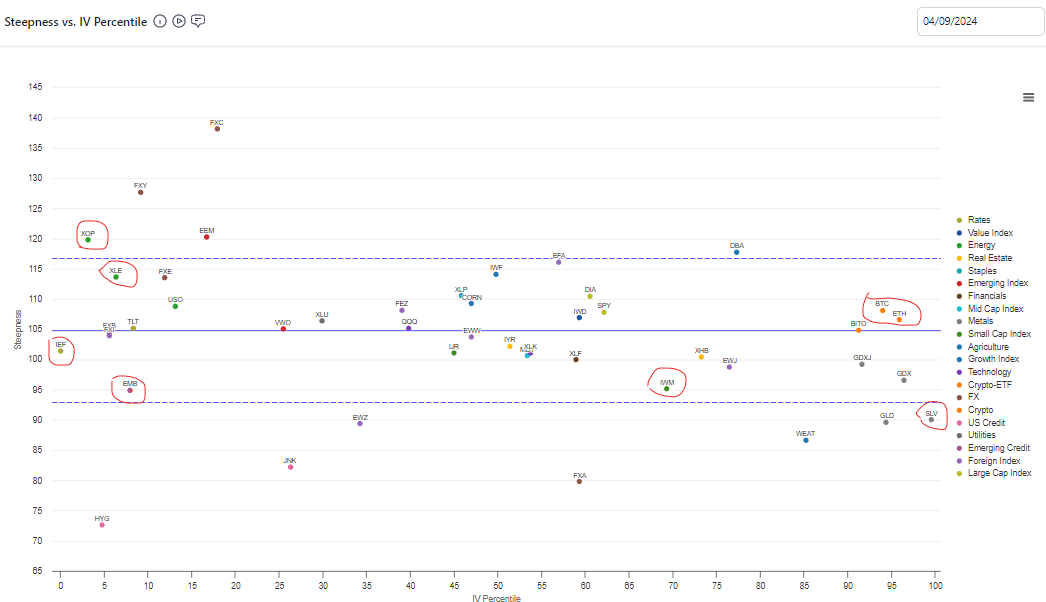
Let’s fill out our Axe List with some of these names according to the quadrant.
The Dashboard allowed us to eyeball a few candidate ideas:
Buy short dated vol in energy (ie XOP/XLE)
Sell short-dated silver and small-cap stock vol. Note that small cap equity, ie IWM, vols look more expensive than midcap (MDY) and large cap (QQQ/SPY). IWM doesn’t pop out necessarily but it’s the equity index with the highest IV percentile
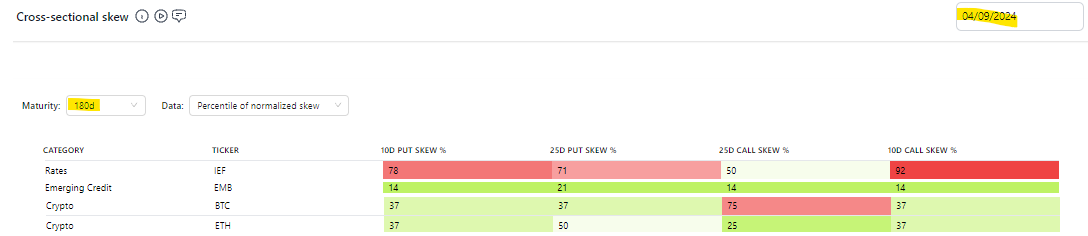
Buy deferred vol in interest rates. IEF is similar to 10-year notes and EMB is foreign credit
Sell long dated vol on crypto
The Dashboard sits at the top-of-the-funnel because it’s a fast way to get a sense of the option market and a launchpad for further analysis. But it’s not complete.
Since the Dashboard only considers .50 delta options, we only populate the “At-The-Money” section. We tackle this further below when we use the Skew tab.
It has no notion of realized volatility which informs the carry or cost of the option. We address this at our next stop: The Real Vol tab.
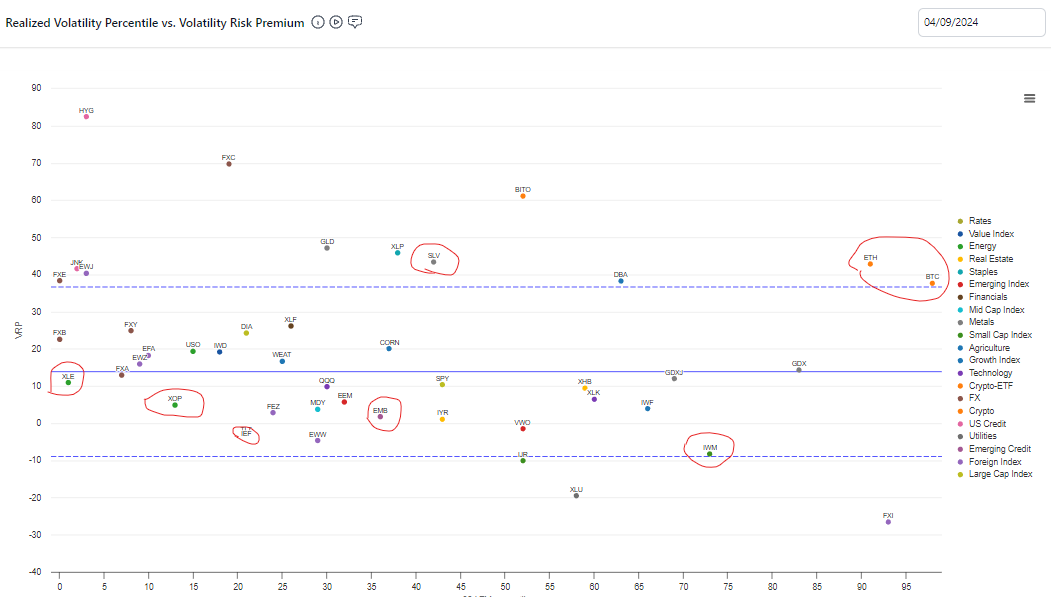
2) Real Vol
The Real Vol tab brings realized volatility into the analysis.
Notes by name:
XOP and XLE: Dashboard told us the IVs are low on a percentile basis. This is not expected. The VRP is low at the same time the realized vols are in a low percentile. In other words, the market is offering you option prices with minimal carry, at a vol level that the realized rarely dips below!
Verdict: Very cheap
IEF and EMB: Not only is IV low, there is no VRP at all. For IEF, realized vol is in the 20th percentile and therefore has a small but real risk of falling further but we like owning the long-dated IV where realized is less of a factor. This risk is higher in EMB where the realized vol is in its 37th percentile.
Verdict: Long-dated options are cheap and the carry is highly manageable because the theta of long-dated options is lower and the VRP is minimal in the first place. IEF looks better than EMB if you’d rather not diversify.
SLV and IWM: SLV short-dated options are not only high (which we learned from Dashboard), but shorts are carrying well — the VRP is extended and realized volatility is near its median.
IWM realized vol is in its 75th percentile and the VRP is negligible. Since we are looking to sell-short dated options we want to cash in on VRPs and there isn’t one to capture. We don’t love selling the longer-dated options either because the Dashboard showed that the market did a nice job discounting those.
Verdict: SLV feels even more like a sale then the Dashboard suggests. IWM is a pass.
BTC and ETH: The long-dated options look expensive via Dashboard and the VRPs are stretched suggesting the carry of being short them is a small tailwind for our p/l. Carry is less important with deferred options as theta is a smaller driver of the option sensitivity.
Verdict: Like SLV, crypto vols are confirmed expensive by Real Vol
Updating our Axe List:
Continuing down the funnel, we now examine if the out-of-the-money options offer more or less attractive targets than the at-the-money options.
3) Skew
On the Skew tab, we will toggle 30d for “short-dated” candidates and 180d for “long dated”.
First, the short-dated axes:
XOP and XLE:
The downside options are trading in lower percentiles so we may prefer to buy OTM puts instead of ATM options and certainly more so than OTM calls.
SLV:
Cheap downside Select an Image
The teeny (ie low delta) puts look cheap and the rest of the surface is within an interquartile range. Unless you are specifically looking for that far downside exposure we can say the Skew view hasn’t changed our axe in SLV.
Moving to the long-dated axes…
IEF: As a buyer you will want to focus on ATM as the skew in both directions is mostly expensive.
EMB: The opposite! The skews are all on the cheaper side so picking either upside, downside or strangles to express the long vol position.
BTC/ETH: Crypto skews are not too notable. If you are looking to sell vol, sticking to ATM looks best. The 25d calls in BTC look elevated but since they stand-alone it could just be an artifact of the snapshot.
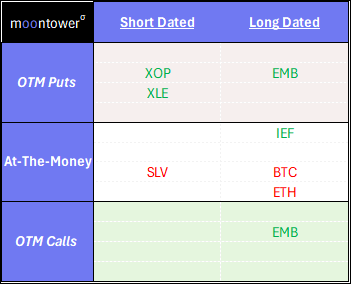
Updating our Axe List:
Checkpoint
Before you touch an option, you need an opinion about how its implied volatility is priced. Option prices are driven by variables besides just which way the stock moves.
You can step through the moontower funnel to populate an “Axe List” which broadly targets parts of the option surface for a set of names.
Your Axe List is a handy map whether you want to bet on direction with options (hedging/speculating) or volatility itself (most popular version of this is capturing VRP)
🔽Download Axe List (File: "Make A Copy")
In the next chapter, Delta Mission, we will use the map to structure directional trades.
Hi Kris - this is a great thread! Quick question: how important is (il)liquidity in options when making risk-defined trades such as credit/debit spreads or buying single call/put options? Thanks!