Introduction To The Moontower Mission Plan
Mission Plan Series #1
moontower.ai has released a new series —> The Moontower Mission Plan
This guides a step-by-step progression for developing opinions on volatility which you can use whether you are trading options to bet on volatility itself, or more likely, to bet on direction.
An installment will be released once a week right here on substack.
If you want to access the entire Plan now, you can become a free member here.
Introduction to the Moontower Mission Plan
Welcome to the Moontower Mission Plan!
The Moontower Primer introduced the conceptual framework of thinking in funnels as well as the details of the specific tools.
This guide is a step-by-step decision tree to take you from wherever your starting point may be to your objective. A mission plan, unlike a script, is flexible. Its nodes take inputs from both the marketplace and your requirements until you arrive at a sound decision.
The subsequent post in the series feel like if-then recipes. You learn to play guitar by starting with simple covers — strum a C for 4 bars, then a G for 2 bars, etc. As you improve, your personality seeps into the performance until you have developed your own style. The recipes are like reading the tablature for “Hey Jude”. They are starting points optimized to jumpstart your growth.
The remainder of this post is to clarify what we mean by “inputs from both the marketplace and your requirements” because they underpin every choice we make within the recipes.
Understanding The Marketplace
A price is a single number at a single point in time. It’s a message:
here is where supply met demand timestamped at 12:58 pm EST on April 20th, 202011
Messages send signals to market participants. When ride-sharing services enact “surge pricing”, it is a signal for drivers to skip dinner and get to work and a signal to potential passengers to take the bus.
Prices in financial markets are also signals. Raise your hand if any of these statements ring a bell:
“The inverted yield curve means a recession is coming”
“The FOMC is 40% to cut the Fed Funds rate by 25 bps and 60% to keep it unchanged”
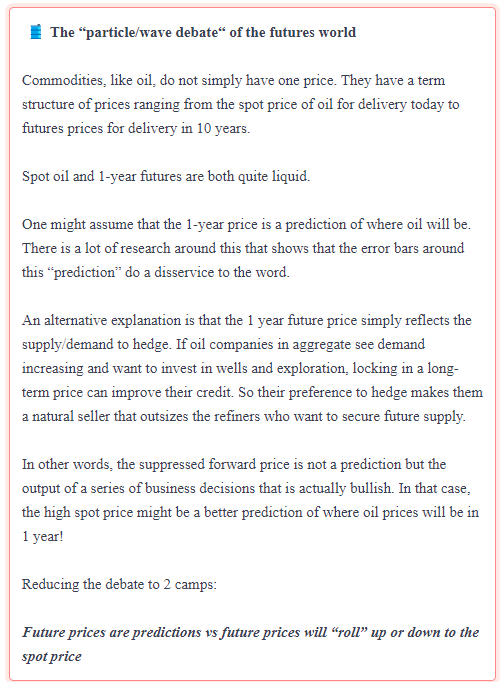
“12-month WTI crude oil futures expect 10% lower prices than current spot prices”
“TIPs breakevens suggest that inflation will average 3% over the next 5 years”
“Company B’s price implies an 85% chance that the merger will close”
“There’s a 40% chance the XYZ’s drug will get FDA approval”
“The stock sold off on better than expected earnings because the whisper numbers were looking for higher top-line growth”
Formal financial theory argues that a security price is forward-looking and aggregates all public information. Talk about pressure.
Look at those statements again.
A single number is asked to convey a lot of information. So it’s not surprising that they are difficult to interpret.
Imagine a teacher seeing the class scored an 80 average on a test. If half the kids score 100 and the other half scores a 60, that is qualitatively very different than if every individual earned an 80.
While a simple average is a signal, there’s still lots of missing context.
Investors use many prices to construct a view of what “the market is saying”. From this perspective, prices are predictive or represent expectations.
If this sounds idealistic, I’m with you.
Prices Are More Than Expectations
Extracting expectations from prices sounds like a monumental task. There are 2 primary reasons for thinking this.
1) Opaque distributions
If you roll a single die the expected value is 3.5
But you will never actually roll a 3.5.
There is a semantic dissonance between expectation as the average mathematical outcome and expectation in colloquial use as a stand-in for "what's going to happen".
We adjust to this dissonance easily when the true underlying distribution is:
Uniform (every outcome is equally likely)
Gaussian (conforms to a bell-curve shape)
Binary (2 outcomes — like a coin flip)
Of the earlier statements, we have an instinctual grasp of:
“The FOMC is 40% to cut the Fed Funds rate by 25 bps and 60% to keep it unchanged”
“Company B’s price implies an 85% chance that the merger will close”
“There’s a 40% chance the XYZ’s drug will get FDA approval”
Our minds struggle when a single price is asked to balance a skewed or fat tailed distribution because we don’t know just how fat the skew or tails are. The boundaries are opaque.
In contrast, the Fed is not going to cut rates by 100 bps when the market is assigning zero chance to such an extreme outcome, because we know there is an implicit conversation between officials and the public. But random variables that are power law distributed (like earthquake frequencies) do not consider us in their plans.
Because investors do not all share the same perception of probabilities and price boundaries for securities, there is an irreducible amount of error when we attempt to extract an expectation from a price that aggregates all investors' assessments of the distributions.
And this is just the simple reason why it’s hard to extract expectations from prices.
2) Aggregate preferences
Expectations are not the only idea embedded in prices.
There is also a premium or discount that reflects the net preference of the herd.
Consider a few examples:
Home insurance costs more than its actuarial value because the the natural buyers vastly outnumbers the natural sellers. There is an opportunity for insurance companies to earn a return by pooling, pricing, underwriting, and servicing the demand to reduce risk. The premium they charge is subject to competition of course but the price of insurance clears above some hurdle that management and investors deem satisfactory compensation.
On average, SP500 puts will be more expensive than any backtest should justify. In aggregate, society is long economic growth. Insurance against systemic risk cannot be diversified away, so the only way the put seller can manage risk is by charging a high price and limiting the bet size.
Investments with lotto ticket properties will often trade at a premium because there’s an investor preference for asymmetric upside and a limit to how the odds any seller is willing to lay. The worst team in basketball might have a 0% chance of winning the championship but nobody is going to lay 10,000,000 to 1.
Tobacco, porn, or other “sin” investments may trade at a discount if large investors are stigmatized against owning them.
These constraints and preferences show how prices cannot just be the consensus of expected value thinking. Nobody buys insurance hoping to win.
Understanding your requirements
The prices in the markets reflect a mix of expectations and preferences. Order imbalances push prices up and down. We use a cross-sectional lens which allows us to see how the price of options relate to the behavior of the assets in a normalized way.
We are controlling for “this is what a typical VRP or term structure looks” like cross-asset. Context and judgement are your qualitative contributions to disentangling expectations from preferences:
“This implied volatility is high because the macro environment is unstable and prices are expected to move. But its paying a larger VRP for BTC vol vs what it’s paying for oil. Maybe there’s a lack of natural BTC vol sellers to absorb this flow, while oil producers are offloading oil calls on this geopolitical rally just to hedge.”
The metrics create the baseline and show us what pops out. Our discretion drives “what to do about it”
Agnostic vs Axed
Vol traders are agnostic about what asset prices will do. They use a volatility framework like moontower.ai to form opinions about the volatilities independent of direction. Vol traders' edge is in evaluating the relative value of options not the direction of the underlying assets.
But most investors don’t do this.
They form opinions about companies, interest rates, and commodity prices. Nobody owns the “global portfolio” of every asset in proportion to some sensible weighting scheme. Even if you are “passive”, your portfolio is biased.
In the trading world, your bias is known as an “axe” (as in “I have an axe to grind”).
Vol traders are axed in option prices but agnostic about underlying securities.
Investors are axed in securities but agnostic or even ignorant about volatility.
moontower.ai imports the vol traders’ lens to investors who use options so they can cross-check their investing axes with their newfound volatility axes.
When the perspectives align, there is a great chance that options are the better expression of the investment axe!
The Axes Align
The vast majority of investor opinions are directional axes.
What prompts you to trade?
Maybe you read something, fell into some cash to invest, need to sell something for liquidity, or just want to hedge.
All of this can be summed up with: directional axe.
Only a minority of ideas will come from a volatility axe.
An axe that says “I don’t know what going to happen, but this implied volatility is so clearly wrong, I’m going to trade it as its own source of edge.”
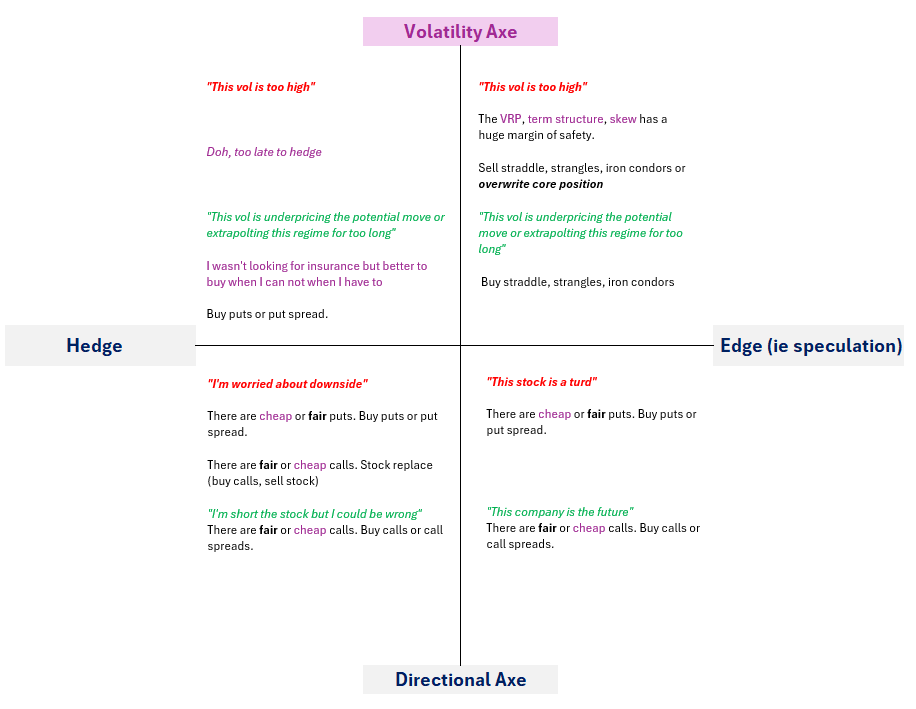
Regardless of the axe, the motivation for the trade is either going to be “hedge or edge”. You either want to cut risk or add risk.
Can you feel it coming?
Yep. 4 quadrants
Keys to note:
The vol trader lens is visible in every quadrant!
In the top 2 quadrants, it actively drove the trade thesis by presenting you a volatility axe.
In the bottom 2 quadrants, we see that options may offer a better expression of your directional axe. Whether you choose to go for fair options is a matter of preference but you would not trade fair options if you start with a volatility axe.
Takeaways
Prices are a tangled mix of expectations and aggregate preferences
The vol trader lens is agnostic on asset prices but axed on volatility.
You are likely axed on asset prices with your trades reflecting a mix of expectation and custom preferences or requirements.
The vol trader lens reveals the options that suit your needs.
When axes align: the overlap of your directional axes and volatility axes drives your option trades!
Next week, we will step through each node of the prospecting tree to identify our vol axes…
References
The approximate time the May 2020 WTI oil future traded $0.00 on the NYMEX


