

sticky vs floating strike

Friends,
Last week, in embedding spot-vol correlation in option deltas, I showed how vol paths use anticipated changes in implied vol as the spot moves around to estimate more accurate deltas. It’s a maneuver that respects delta fully as a hedge ratio rather than its narrow textbook sensitivity of “change option price per change in underlying price, all else equal”. We are sure (enough) that all else ain’t gonna be equal, so we can use the knowledge to improve the hedge ratio.
The post explains how a “vol path” takes a slope parameter that dictates how ATM vol changes as spot moves. For example, a slope of -3.0 means a 1% rally drops ATM vol by 3% (ie from 20% to 19.4%, not 3 clicks such as 20% to 17%). It’s like a “vol beta”. We can even see -3.0 slope by looking at a 1-year beta between SPY and VXX based on daily samples.
A stylized view of how this works:
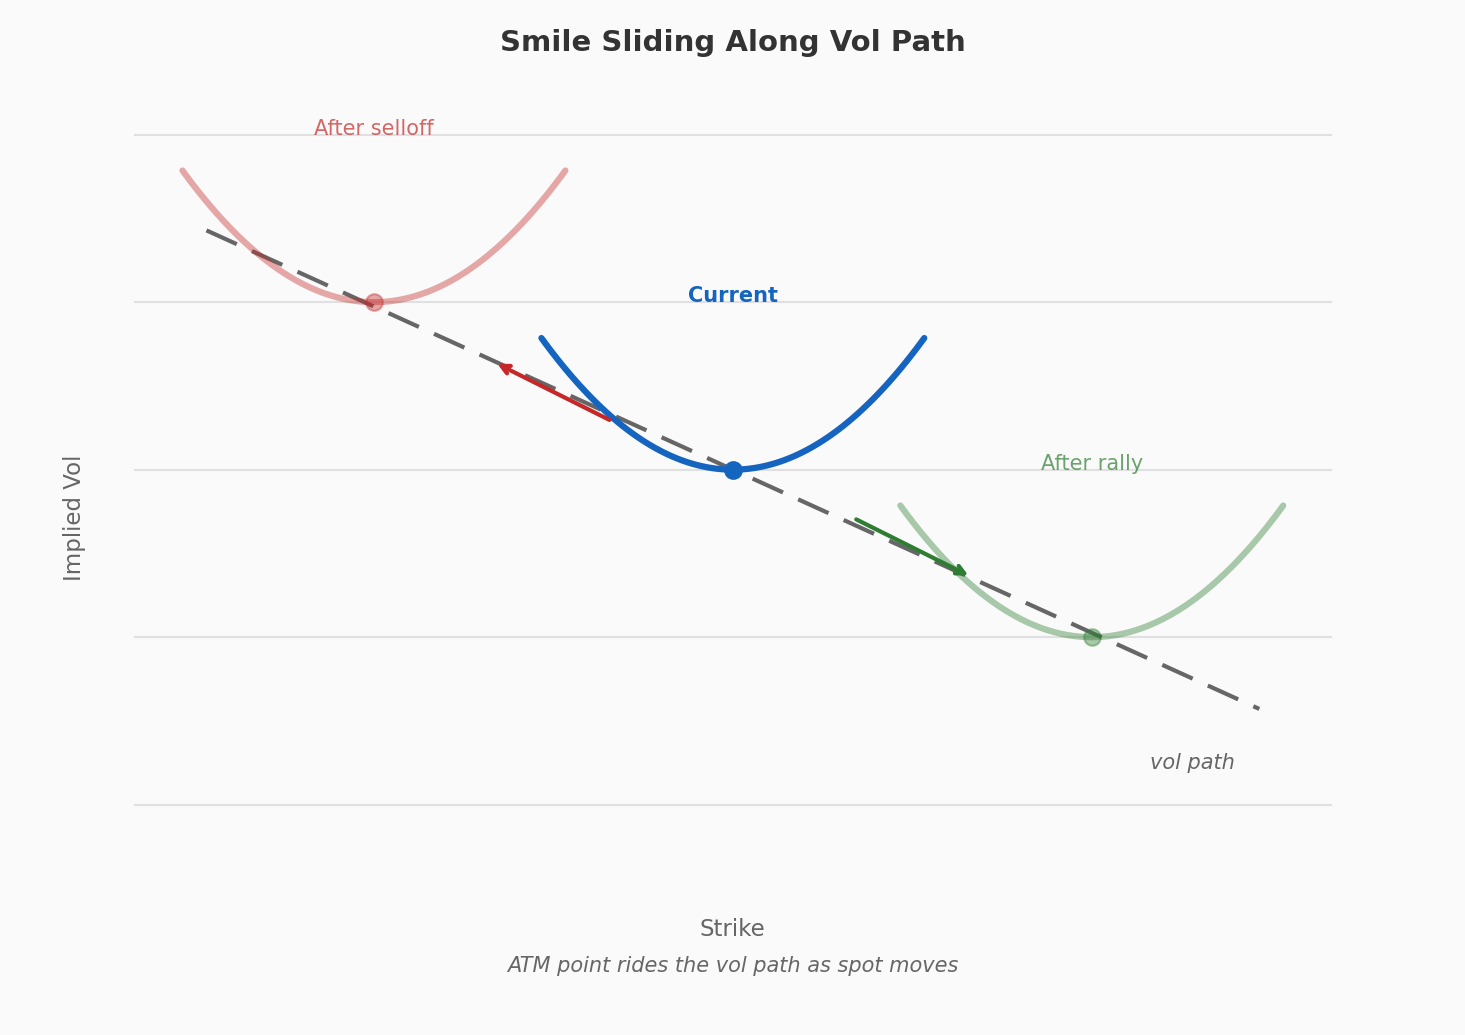
The vol path only affects the ATM vol. If the smile remains the same shape along the path, the vols of all the options also change. That’s not all. The skew, measured as normalized skew or the percent premium/discount of OTM strike vs the ATM strike, is also changing if the shape stays the same but ATM changes.
While vol paths describe the ATM vol, there are skew models that describe how all the options for a given expiry will change. Just like the vol path concept, the goal is to make better predictions of how a portfolio of options will react to stock movements without pretending that vols don’t change. This is an opportune moment to remind you that the presence of a smile in the first place is a patch to the faulty Black-Scholes assumption that vol is constant. If the strike vols don’t change as the spot moves, the ATM vol still does since you have “moved along the smile”.
The entire branch of quant devoted to modeling option surfaces stems from the knowledge that vols change as the underlying moves and that there is value in trying to forecast those changes rather than accept a null prediction of “vols won’t change”.
There’s no controversy about whether there is value in modeling the dynamics of option surfaces. Better models improve:
Risk measures. VAR needs assumptions about how the surface reprices when spot moves. Your hedge ratios are direct outputs from portfolio scenario shocks and their assumptions.
Market-making. Sound models mean the ability to recognize abnormal kinks within a name or cross-sectional divergences between names. A model gives you a baseline from which to judge “how strange is this surface change”? If the skew rips by X, do I expect that to pop back into line or is this within the realm of normal, given the market’s movements?
Option pricing on illiquid names. How do I estimate option values in a name with sparse quotes? A good model fills in the blanks.
My goal with this post, like all of my posts, is not to give it an academic treatment but the non-quant practitioner’s perspective. To offer an intuitive angle to either better organize your understanding, whether this is new to you or if you come from a similar vantage point OR complement the textbook rigor that some readers possess.
As the title suggests, we are going to reduce the topic to 2 basic types of skew modeling approaches — “sticky strike” versus “floating”. The fact that there are 2 is a hint that neither is fully “correct”. Just like skew itself is a kluge, the entire domain of surface modeling is basically a kluge. Beyond hard arbitrage boundaries, the relationships of options to one another is a collection of informed guesses mediating a constantly evolving conversation between models and behavior.
The typical George Boxism “all models are wrong, some are useful” applies. Models are toys by necessity — if they were actual simulations of reality then the reality is simple enough to not need a model. Nothing about the future of a security price satisfies that requirement.
Our procedure here is to assert the model, see what they would predict if they were true, and then watch them break by hypothesizing the trading strategy that would profit from the models NOT breaking (which of course is a blueprint for why they must break).
The nice part is that this is mostly a visual exercise so don’t be discouraged by the post being too long to fit in the email…it’s a lot of pictures.
