

stacking carry: an inflation hedge you get paid to own
layering edges faster than risk when correlations are negative

Friends,
US bond yields are rising as inflation re-enters the conversation. The 10-year yield is up to 4.65% and 30-year bonds have just crossed 5%, a nearly 20-year high.
This isn’t surprising. 6 weeks ago, in Trading As A Sudoku Puzzle With Prices As The Given Numbers, I talked about how 1-year gasoline futures were trading at a 1/3 discount to prompt pricing, but if gasoline prices remain high, this will roll up. If spot prices stay high for a year, those back-month futures will converge to current prices. Even though energy is only about 5% of CPI, the size of such a sustained move would easily transmit 1.5% to inflation indices and that is just due to direct energy effects and ignoring indirect effects on food, construction, and transport.
We’ll switch the conversation to crude oil just because it’s more widely tracked and the specifics of the contracts aren’t critical to where we’re going. Prompt oil is roughly in the same place vs 7 weeks ago, but the contract that was 12-months out and is now 11-months out has rolled up >6%. Meanwhile, another month of sustained high oil prices has pushed the 10-year yield up 30 bps from 4.3% to 4.6% with IEF price returning about -1.6% a bit better than what’s expected by its duration.*
*There’s some leeway since I’m using an index for the yield which may have a different set of weighted maturities than IEF holds. Also, IEF total return is closer to -1.1% because you earn interest for 7 weeks.
So far, so good. The reaction function in bonds makes sense. But my Sudoku post claimed that an inflation-induced yield bump would transmit to real equity risk premiums. In other words, I would expect equities to sell off with bonds, or heck, at least not have such a sharp rally.
This is not quite the puzzle it appears to be. The equity exuberance is actually quite limited if you look under the hood of the index.
From Shannon’s substack:
The internals are doing something the people who watch this for a living have never seen. The S&P is up 4.2% month-to-date with 209 stocks up and 295 down. The NASDAQ is up 8% month-to-date on a near-even split (51 up, 50 down). The index is 9% above its 50-day moving average while only roughly half the components are above their own 50-day; at that distance you’d normally expect 80% breadth. Four days running, more S&P stocks hit new 52-week lows than 52-week highs, with the index at all-time highs and up 30% year over year. Yesterday 9% of the index hit new lows. None of this happens together in a healthy tape.
I’ve noticed many market people interpret these “internals” as bearish. I’m not sure this is bearish for the index. It just is. A few companies are eating everything else. We get it. At this point, the low cross-correlation of the components is common knowledge (isn’t this what managers call a “stock pickers market”?).
Rather than use the term “bearish” which has a predictive slant I can’t justify, we can just accept that the sustained oil price, inflation jitters, and rise in yields are being reflected in prices broadly. SMH (semis ETF) is near 1-year highs while XHB (homebuilders) are near one-year lows.
The AI story is in a parallel vacuum, indifferent to relics like discount rates or identities such as spending = income, but stocks overall are not being indiscriminantly bid. SPY has returned nearly 2x RSP, the equal-weighted SP500 index, over the past year. So the loving arms of our cap-weighted benchmarks hold us tight, shielding our eyes from the turmoil within. Trepidation over supply-side inflation is confirmed by bond and non-AI stocks alike.
Concerned with inflation, I dust off some old posts, like What I Learned About TIPs which I wrote when I bought when breakevens shrunk to about 2.2% (green box).
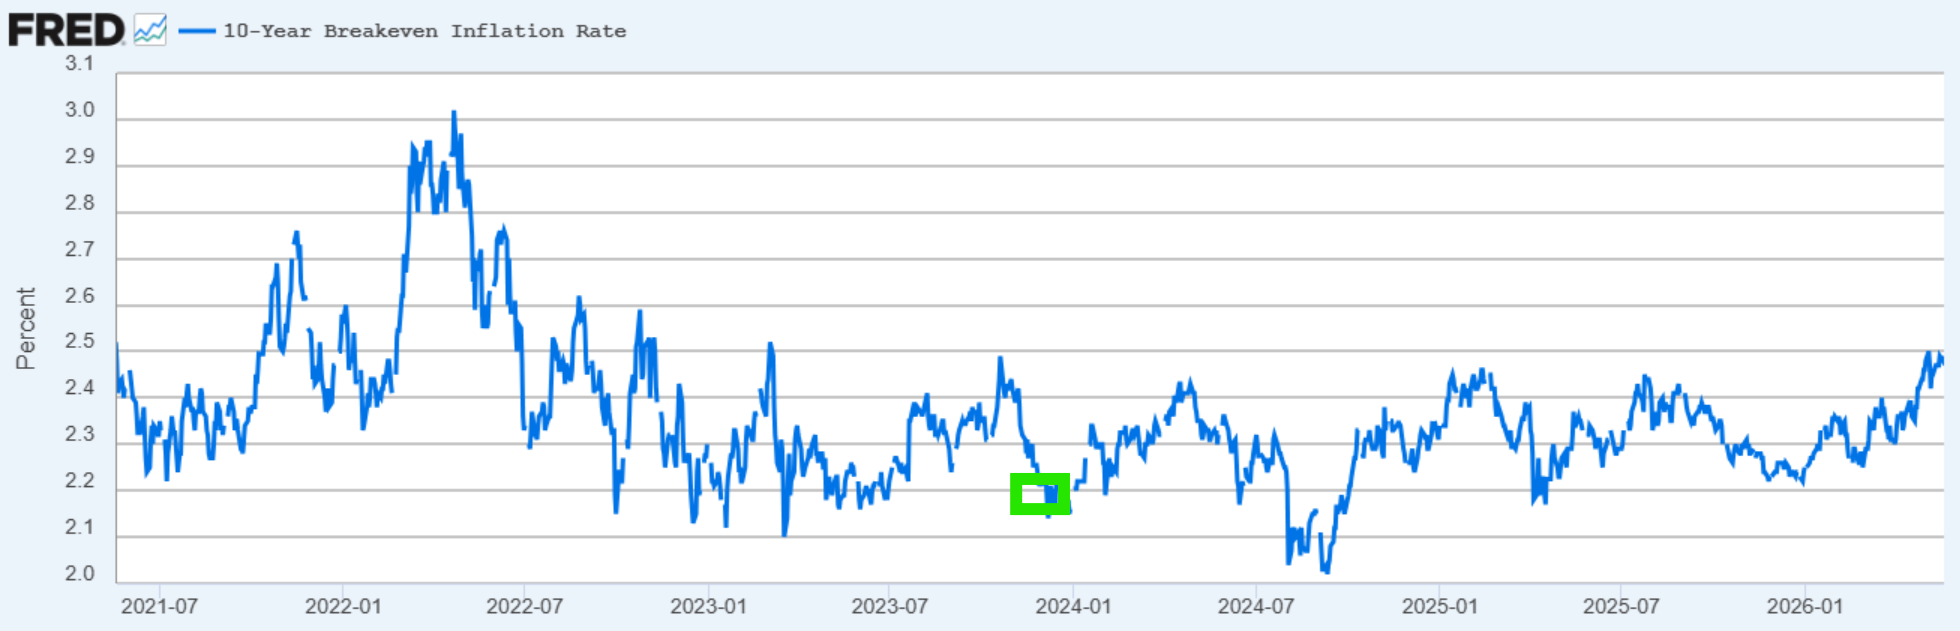
(When breakevens are skinny, TIPs are relatively cheap compared to nominal bonds, and when they are fat, they are relatively expensive. The way to think of that is if you buy TIPs at say 2% breakevens, then you are better off with the TIPs if CPI realizes more than 2% and vice versa.)
Breakevens are currently matching 3-year highs so TIPs don’t look attractive on a relative basis, but that’s only one lens. The real driver of my decision to buy TIPs in Oct 2023 was the absolute real rate which was ~2.45% which still stands as the peak for most investors under age 40’s working life.
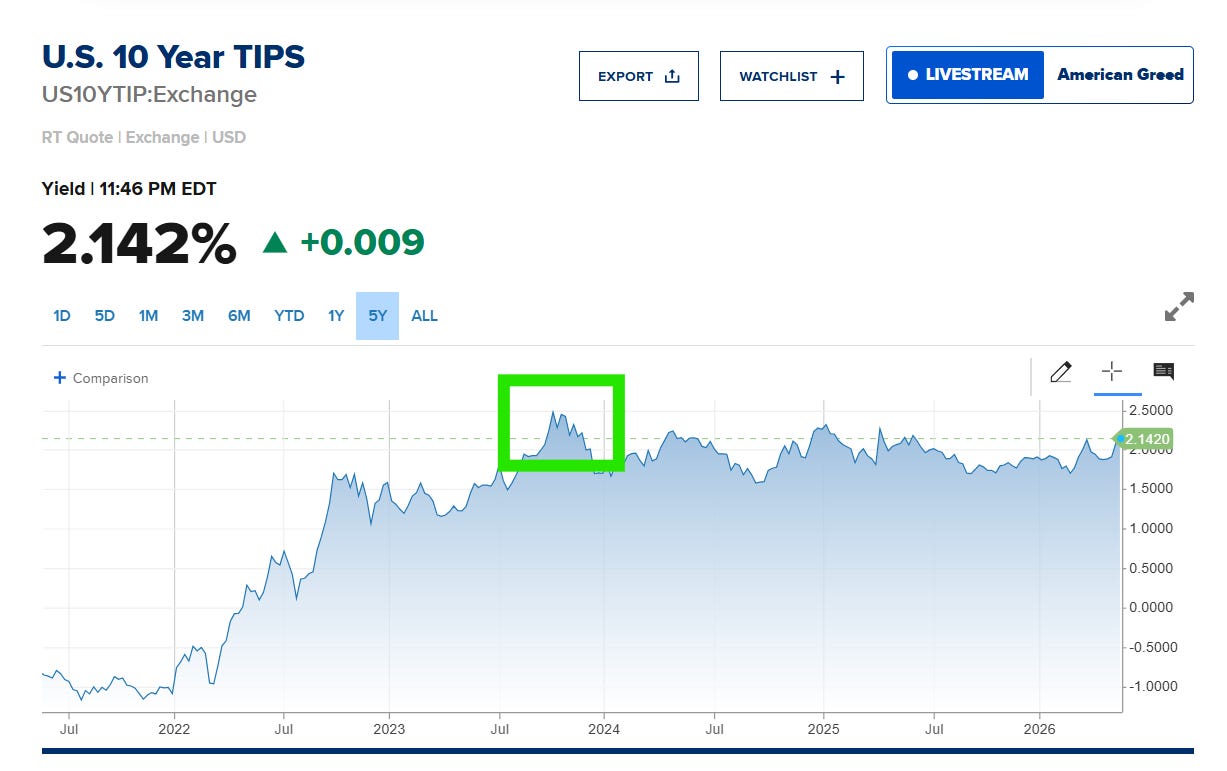
Remember that’s 245 bps of return above inflation for no risk and if you hold them in an IRA, no tax drag. Historically speaking, equity real returns have been in the range of 3-6%, but recent years have been quite a run of heads. Whether the coin is biased now is a question for someone smarter than I. But I digress.
The point is I’ve started once again to consider inflation-aware trades. 10-year TIPs don’t stand out as a bargain relative to nominal bonds. I’m wary on gold and silver because of how well they’ve performed recently, but also historically, they have not been great to own when real rates increase and we can see from the absolute TIPs rate that, despite breakevens not breaking out, real rates are crawling higher, approaching an 18-month high.
So I dust off yet another post, this one from 2 years ago: Inflation Replicator. I show how a portfolio of oil futures plus nominal bonds mimics the behavior of inflation-indexed bonds like TIPs. I constructed it in Composer using USL, which holds a strip of oil futures maturing within the next 12-months, plus TLH, a bond ETF holding bonds with 10-20 year maturities. The portfolio is inverse-vol weighted, rebalanced quarterly.
This is the out-of-sample performance since I published the post (green line).
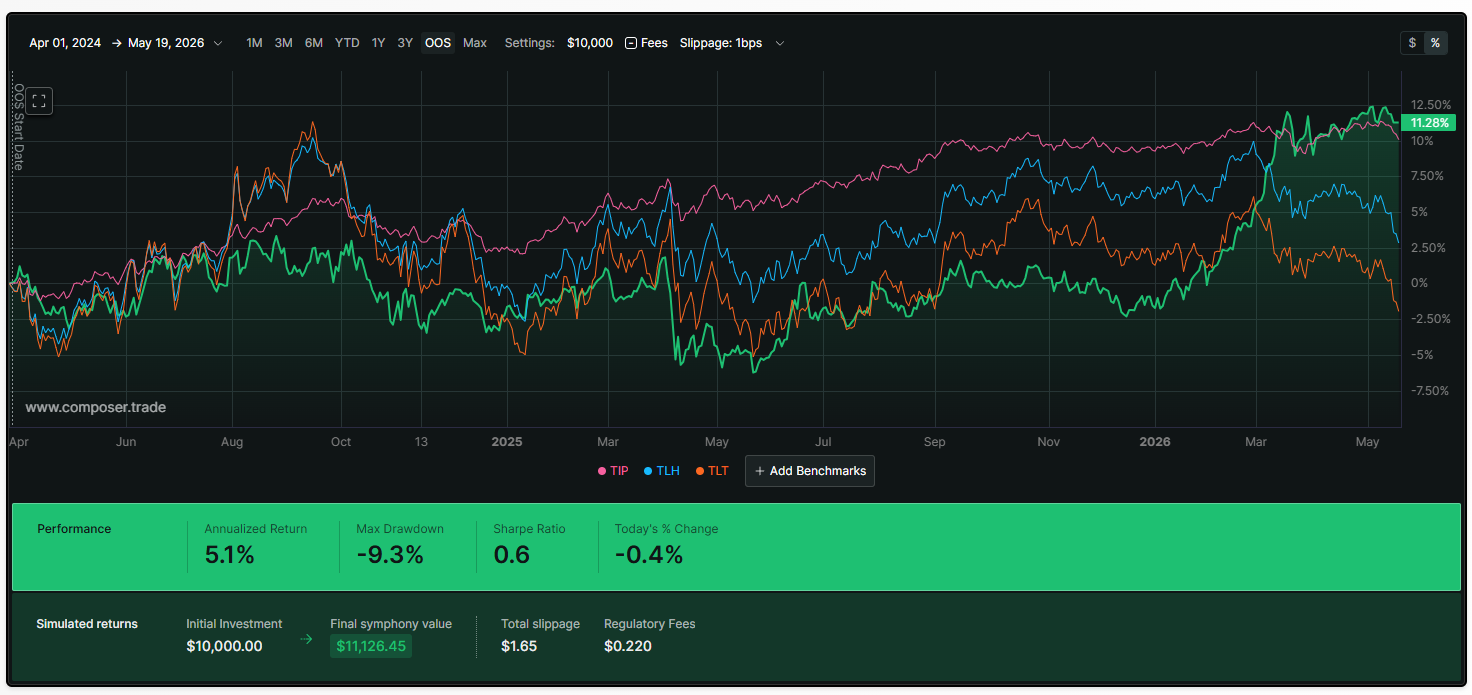
That portfolio is a set-and-forget inflation hedge if you don’t like TIPs.
[Speaking of “tips”, here’s a general one. If you have a portfolio that rebalances, it is often selling winners to re-invest in losers. This keeps you diversified and avoids the volatility tax that comes from concentration, but it’s not tax-friendly unless you do it in a sheltered account. To do it in a regular account, you can consider a tax-loss overlay where instead of buying more of the losing position, you actually sell the losing position and another ETF that has a highly correlated exposure. So, for example, if TLH is the losing side and you need to add more on the rebalance, you actually tax-loss harvest the TLH and replace it with TLT length. It’s a similar exposure, but you can now use the TLH capital loss to offset the gain on the USL win you trimmed.]
The specific inflation replicator I composed was TLH + USL. But if we abstract it to “bonds + oil”, it invites us to think about risk premia that exist in both asset classes in the current market.
In the remainder of this post, I’ll narrate layering a couple of edges onto a core portfolio idea. By following along, you’ll get concrete ideas for measuring and managing risk and open your mind to the different Legos available to build the portfolio and ultimately express the trade while targeting the carry embedded in the asset’s pricing complex.
