

Ratio'd
The follow up to Breakpoints

Friends,
Last week in Breakpoints, the discussion was about measuring implied skew.
A common measure and the one we use in moontower.ai is normalized skew which computes the percent premium or discount of IV at the 25d strike vs the 50d strike.
It’s not a measure that lends itself to direct interpretation. If 50d IV is 30% and the 25d put is 36% that’s a normalized skew of 20%. It doesn’t mean anything on its own but it is useful to see if skew is relatively or historically high or low. You chart it as a time series or percentile the value on a 1 or 2 year lookback. You can compare skew cross-sectionally across correlated assets.
Skew, or any measure, can be attacked from any number of angles. Our single measure of normalized skew itself requires choosing tradeoffs. The last post addressed the biases of various breakpoints. Moneyness, standard deviation, and delta-relative are all common ways to fix the gridpoints.
Today, we’ll use an approach that many might find more intuitive — thinking about skew in terms of option premiums instead of implied vol. When we look at option chains we are looking at prices. When we trade options our p/l depends on how the premiums change. For many investors, premiums are a more natural way to think about options than IV.
We will use GME to demonstrate a number of ways to think about skew which are more tightly intertwined with how skew trades are expressed — through verticals and ratio’d verticals.
We can even turn the metrics into a simple oscillator based on arbitrage bounds. If I do my job right, this post will make the concept of skew more concrete and inspire you to track it in new ways.
I started this GME case on a data exploration lark. Baycrest option strategist David Boole said that the call skew on the latest rally surpassed even the 2021 craziness. I wanted to look myself but I didn’t want to just look at normalized skew by delta.
Because I knew the call skew was so fat I was a bit uneasy about the recursive nature of delta-relative gridpoints. The last post uses a concrete example to demonstrate how option vanna causes the delta of an option to change with the IV which muddies the answer to “what did skew do today?”. Truthfully, this is a nerdsnipe for non-vol traders, but as a vol trader it’s bothersome enough that I wanted to choose a different tradeoff.
I opted for a standard-deviation relative surface for the study instead.
Let’s step through it.
1) Pull end-of-day GME data from 1/4/21 to 6/14/24
In particular:
.50 delta IV for the option closest to 30 day expiry (range of actual expiry dates in ranged from 27 to 32 DTE)
The breakpoints that correspond to 1 and 2 standard deviation OTM upside strikes estimated using .50 delta IV and actual DTE.
Call premiums at the closest strike to the breakpoint subject to some error tolerance (ie the strike needs to be within 10% of the breakpoint IV but that 10% is scaled to IV. If IV is only 30% than a 10% divergence from strike to breakpoint is not acceptable but if IV is 250% than it’s ok). If no such strikes were listed the day is omitted.
The vega of each option. I also estimate the vega of the theoretical ATM call using the approximation .4*S√t
Call premiums are normalized by measuring them as a percentage of the stock price.
2) Chart the 1 and 2 std dev OTM call premiums as % of stock price.

The .50 delta IV is on the left-axis. We can see the recent spike relative to the early 2021 spike. We can also see how the 1 and 2 st dev OTM calls explode in value.
But we expect option prices to rip when vol explodes.
Skew is an attempt to say something about how the relative value between options of the same expiry change. So far there’s is no notion of skew.
That sounds like a job for tracking a vertical spread as percentage of the stock price.
3) Chart the 1 SD / 2 SD call spread.

Hmm…this feels unsatisfying. The call spread is also spiking with the call values. We’re not learning much from displaying the spread.
There’s a good reason for that.
These call spreads, like outright calls have positive vega. As vol increases, OTM call spreads increase in value.
Instead let’s look at the 1x2 ratio call spread.
4) Chart the 1 SD / 2 SD ratio call spread (2 further OTM calls vs a single 1 SD call)

Ahh, now we are seeing the value of the 1x2 decline on spikes in vol. In other words, a structure that is long 1 OTM option and short 2 further OTM options is losing value when vol roofs. It’s hard to say what’s driving this however.
As IV increases, OTM options gain vega. Not only do the options go up in value, but they become more sensitive to IV. This is vol convexity. Every uptick in IV increases the option value more than the prior uptick. Like your position is growing! This is the “gamma of vol” or vol convexity.
At an extremely high level of vol, all OTM options approach .50 delta. The vega of options of different strikes will converge.
Assuming you own the lower strike and short 2 further OTM strikes, the 1x2 starts as a long vega trade from low levels of volatility. But it is short vol convexity or “gamma of vol”. At crazy high vols, the vegas converge and your net greeks converge to the net amount of options in your position — in this case you are net short 1 option. Your position vega, or sensitivity to IV, is now negative. So as vol spikes, the 1x2 loses value.
(Another way to think of this is that a 1x2 is equivalent to being long 1 call spread plus being short an extra option. At high enough vols the call spread’s net vega is a wash and you are just short an option.)
The picture above makes it hard to disentangle skew changes (ie the relationship between the 1 and 2 SD strikes). It is confounded by the changing vega of the structure.
Let’s back up and simplify for a moment.
We can compare the ATM call with the 1 SD OTM call so we aren’t trying to parse skew changes across 2 OTM options. And we’re going to control for vega itself!
5)The vega-neutral call spread
Instead of fixing a ratio such a 1x2. we will stipulate that our call spread must be vega-neutral. To do that we simply solve for the ratio that makes the vega of structure zero. In other words, we count how many OTM calls we need to short, for each ATM we are long.
The fewer options we need to short, the steeper the skew must be! In an infinite vol situation, all calls go to their maximum value — the stock price itself. Which means the call spread is worth zero (since all the calls are the same price) and each call has the same vega (which is weirdly zero — at infinite vol, changing vol by one point isn’t going to change the option value).
I like using extremes because they establish arbitrage endpoints from which to reason backwards from. In a high but not infinite vol situation, the ATM and OTM calls will not be equal. But perhaps the ATM call vega is just a bit higher than the OTM call. In that world, you only have to sell slightly more than 1 OTM call to be vega-neutral.
Repeating — the lower the ratio of the vega-neutral spread, the steeper the skew.
Here’s the chart.

Remember, this is a vega-neutral ATM/ 1 SD call spread. In the recent spike, the OTM calls were so jacked compared to the ATM that selling 11 calls for every 10 you bought would have been vega-neutral!
Let’s reproduce the chart but shifting the strikes to 1 SD vs 2 SD.
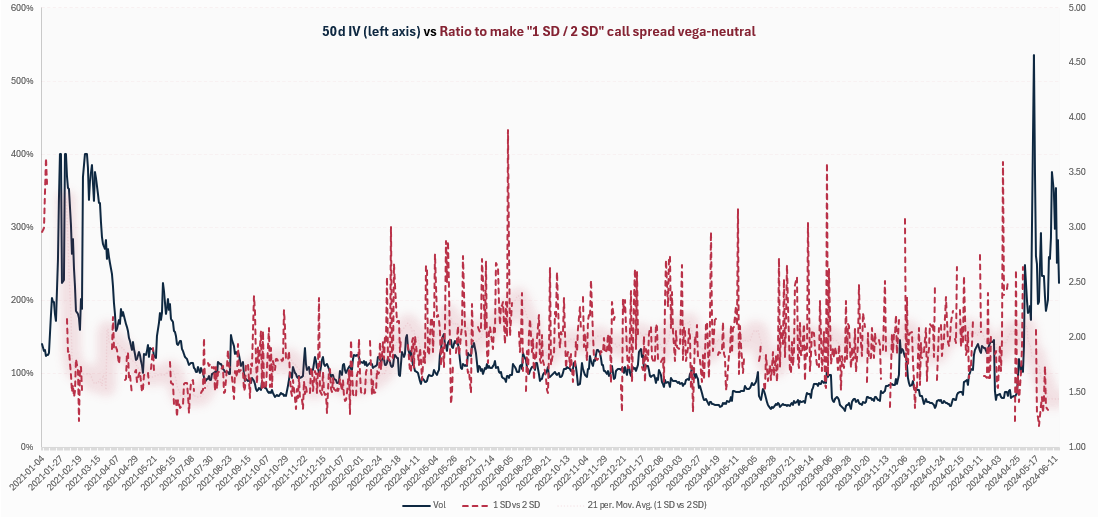
The picture is similar but the ratio to make the spread vega-neutral is more volatile. (That 2 sd call is also noisier because when the premium is only say 1% of the stock price, slightly leaned or errant marks matter more.)
Extra: A 1x2 indicator
By tracking the ratio of further OTM options needed to make a spread vega-neutral is an alternative way to track skew. Like normalized skew it reduces vol artifacts but because it maps to option premium as a percent of the stock price it feels more interpretable. “Wow, the skew is so high I can sell 50% less options to finance the same long premium” or “I can own 3 OTM calls for the price of 1 ATM”
In practice, the option markets tend to coalesce around some common structures. The 1x2 vertical spread is an easy to ratio to keep in mind. It becomes like a tool in the trader quiver…they might look at a surface with low or high skew and gravitate to “how’s the 1x2?”
If we fix the ratio as 1x2, accepting how its shorthand does conflate vol and skew effects a bit, we can create an indicator that has the same shape but lives on an oscillator — it’s bounded by 0 and 1.
To do that think of the extremes.
a) The most a 1x2 ratio call spread can be worth (from the perspective of owning the 1 and shorting a ratio of the further OTM) is the premium of the 1.
Example:
A stock is $50 and the 1 sd strike is $55 and the 2 sd strike is $59. If the 55 call is worth something and the 59 call is worthless, then the ratio is simply the value of the 55 call.
b) The least a 1x2 ratio call spread can be worth is the -(the premium of the 1)
Example:
Vol is outrageously high. There is little difference in premium between OTM strikes. In other words, the call spreads are worth very little. Much like GME recently where the 55 and 60 strikes were almost the same value. We’ll be dramatic and say both calls are worth $1. The 1x2 is worth -$1. If you buy the 55 call and sell 2 60 calls, you’ll collect a $1 credit. The credit cannot be larger than this since the 55 call cannot be worth less than the 60 call.
With an upper and lower bound on the value of the ratio we can simply compute the value of the 1x2 in relationship to its range.

Here’s a time series of the GME 1x2 oscillator:

Wrapping up
The point of this post was to provide more angles to rotate the idea of skew in your head. In the process, I hope I was able to convey how implied volatility influences option prices both absolutely and relatively.
As GME goes, the skew does in fact look like it climbed higher than it did in 2021. It’s most noticeable in the simple ATM/ 1 SD vega-neutral spread.

But the peak of the skew, wasn’t that much higher than the peak in 2021 suggesting the market adapted pretty quickly the first time around. After all, option market makers presumably learned “total nonsense is possible”. They had the benefit of the 2021 experience to draw from in setting curves and didn’t push it them too much further than they did back then.
The craziest event is always in the future, but it’s not unreasonable to reference the GME case as a point of comparison the next time skew explodes in a name and you are wondering “how ridiculous is this situation compared to the Roaring Kitty meme sheets?”
Food for thought
About 20 years ago, as a still junior option trader, I interviewed for an options trading role at a fund chaired by Myron Scholes. They were called Platinum Grove iirc. LTCM lineage. I wasn’t smart enough to work there. A fortuitous miss because I think they got blown out in 2008. I don’t know for sure so don’t quote me. (I can speak more freely in the paid letters but I don’t want to offend or misrepresent unfairly either. This is just what I remember and I didn’t care enough to verify.)
Anyway, one of the pre-screen questions was how can you construct a market-neutral long vol convexity position?
The answer they were looking for was a ratio iron fly. Assuming a “typical” vol surface, you can buy about 1.4 25d strangles for each ATM straddle you sell. The position will be flat vega but:
a) as IV falls you get shorter vol
Think of the extreme where IV falls to something like 5%. The strangle you own is worthless and you are short a straddle. Your vega is short. As IV falls, your vega falls. You are long “vol gamma”.
b) as IV increases you get longer vol
The straddle goes up in price but it doesn’t gain vega. ATM (technically ATF) straddles are already at maximum vega! But the strangles you are long, gain vega so as vol increases they start gaining value at a faster pace than the short straddles hurt you.
A ratio iron fly is equivalent to a ratio call spread + a ratio put spread. If you widen the strikes from 25d to say 10 delta maybe it’s a 1x2 call spread + 1x2 put spread. By tracking the prices of specific structures normalized to the stock price you can get a sense for how the vol surface is behaving without knowing the IV on the strikes themselves.
You will still some concept of vol to measure the distance of strikes from one another whether it’s delta or standard deviation.
You can also fix the price of structures and invert the questions — “how far apart are the strikes I need to construct a zero-cost collar” or “how far apart are the strikes that make the 1x3 costless”? Then the distances become values you can track in your analytics.
The more you can apply a familiar lens to various opportunities the more you can build a mental pattern-matching library for what looks “off”.
It might sound salesy but this very much why the moontower.ai approach is so dear to me. Once I left the desk, I felt blind because I was so accustomed to seeing markets from a lens that efficiently filtered what’s normal from abnormal amidst all the noise. As a discretionary trader, it was the ladder to the diving board. There were still steps to take before you jumped but most of the effort was handled in the canned measures.
moontower.ai is building to recover my sight. In the process, we can give other option users the same vision regardless of what their objectives are.
Stay groovy
☮️
Get your vision upgrade!
🎁Paid subs to moontower.ai get moontower.substack for free
💰Become an affiliate here
Thanks for the post! I think these are all very clear/valid ways to view skew. Just a follow up question to kinda poke your thoughts.
How would one view skew in a "forward vol" manner? E.g. skew in each time bucket. Is there value viewing it that way when trying to gauge its term structure.
Thanks for the post, I have few questions.
1. While putting on structures like vega neutral call spread we would be left with delta exposure. Do you consider getting your delta neutral?
2. Is risk reversal only a spot vol structure or can it be used to express skew as well?
3. Regarding ratio ironfly, isn't it a kurtosis structure rather than skew structure? Where we find tails are cheap and ATM is expensive relatively.