

hedge ratios

Friends,
Net of last week’s April expiry the flurry of trading from the last few weeks has left me net long delta. That’s not accidental. I had plenty of room to be a buyer on balance in the turmoil since cutting lots of portfolio delta heading into the election.
[If interested…I rebalanced much of stock delta into t-bills bills then re-deployed into bonds, TIPs and silver in late January.]
Coming out of the April expiry last week, my position gained ES futures, VIX futures, IBIT, with my only outright option position being some May AAPL put spreads.
Back in November I published this video which show how I look at the risk of our household portfolio.
But in the flurry of trading while I’m mentally separating what I’m doing for edge and my total portfolio, I do have some delta bias under the hood to effectively dollar cost average since I de-risked in October.
But I want to keep close tabs on how much I’m adding which means summing positions in a vol or even better beta-aware fashion. NVDA is far more volatile than SPY so just as traders combine all their deltas into SPX or some other benchmark terms I like to also normalize back to SPY equivalent risk.
This is a doorway into hedge ratios and beta-weighting. Beta-weighting is not just vol weighting but includes correlation.
I’ve written extensively about how to do this in:
🔗From CAPM To Hedging (17 min read)
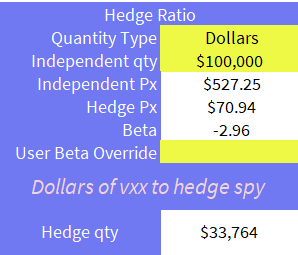
That post steps through derivations and the basics of correlation math but in my personal portfolio spreadsheet I needed to make a little widget where I could just put 2 symbols and get a hedge ratio.
We actually have a calculator in the app but you need to supply the inputs.

However I realized with Excel’s built-in =stockhistory I could not only get the inputs, but easily plot time series and scatterplots to understand the shape of the “idio” risk and variation in the beta over time.
🚀We are going to add this functionality to the moontower.ai app. We already have the data, just need to extend the UI.
In the recent month, I wanted to understand how many SPX delta equivalent I had in VIX futures. I used VXX as a proxy put it into Excel and voila got some idea of how much “less” long SPX I am with the VIX futures incorporated.
So….
I made a video walking through the Excel tool. It’s some of the most practical traders-use-this-everyday-type knowledge. We skip the derivations and jump to how do I actually use this data to size hedge ratios or estimate my book’s beta.
I hope you find it as useful as I think it is. (If not, I’ve got more work to do on the explanation side so let me know!)
Paid subs get the spreadsheet. If you have the stockhistory function in Excel this will work seamlessly for you. It’s addicting to toggle thru pairs so fair warning!
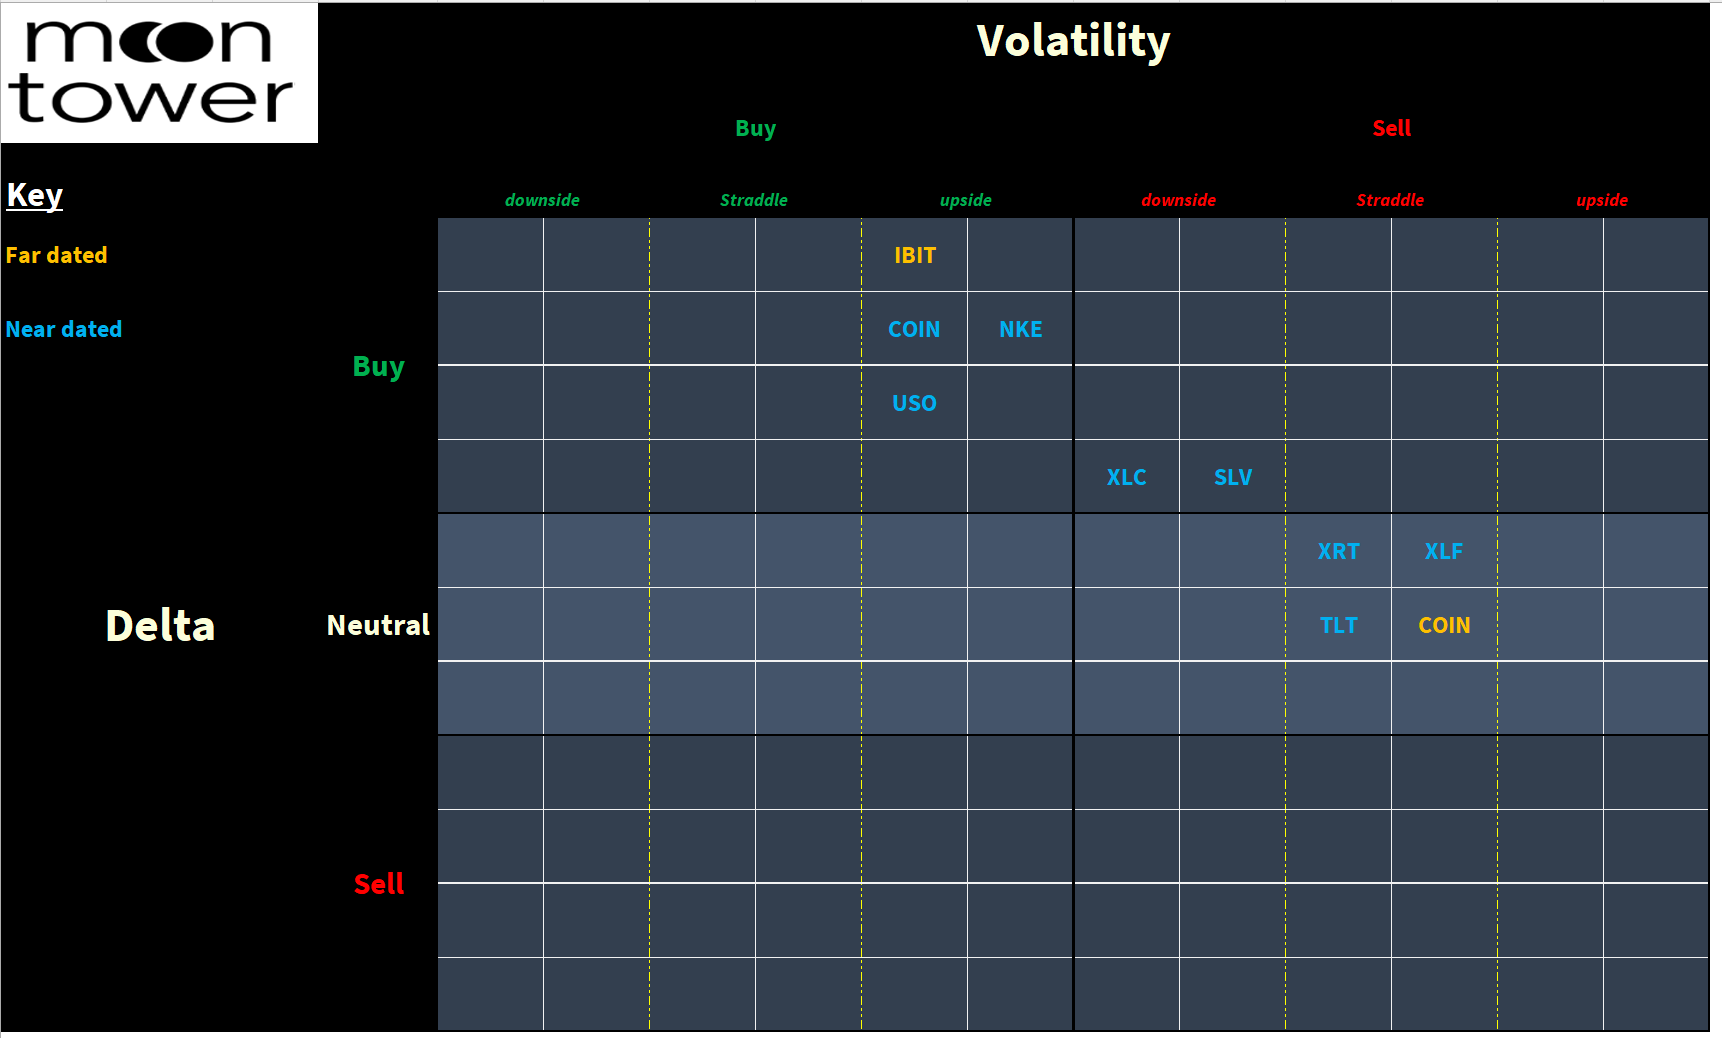
The spreadsheet link below has 2 bonus items not shown in the video:
1) A widget for spitting out the hedge ratio not just running data
2) A little position radar template on a separate tab to keep your gameplan organized
Before getting to the sheet, tomorrow night is Ricki Heicklen’s Trade Gala party in SF. I mean yesterday we learned that Jane Street made $20B in 2024 which doubled what they made in 2023 which shattered their record from the prior year. I think they are the most profitable firm in the world per employee (they have about 3k employees).
I think it was Morgan Housel who once wrote that very few orgs in the world could say their edge is just flat out “we’re smarter than you”. There’s usually some other sauce. He gave the example of RenTec. Jane Street is another that can boast the same. This is a cool opportunity to see how that crowd thinks.
This is a special moontower invite that Ricki sent me. She’s repeatedly acknowledged that anyone she meets that comes out of this community is a breath of fresh air which she poses as a compliment. I’m not one to insult a compliment but it’s a testament to y’all. I don’t control how you act.
Anyway the party starts at 8pm and runs thru 6am…well I’ll let you click on this yourself. This is actually a custom invite for Moontower readers:
A quick description..Trade Gala is a limited-access costume party with markets, a puzzlehunt, and demo-ing a new trading game.
If you want to attend the trading BootCamp the rest of the weekend sign up below. It’s truly ridiculous. If you are a novice it will open your mind to what trading looks like thru the eyes of sharps. It is hard to come by this in the level of detail you’ll see here.
If you are a pro, well, you might want to know you might notice some things that you are up against. There’s a lot to learn for everyone.
