

Go forth and tinker
The Moontower Option Chain spreadsheet

Friends,
In last week’s video, I explained a bunch of topics using something I’ll call the Moontower Option Chain spreadsheet.
I cleaned up a touch and paying subs can download their own copy below.
A few notes on usage:
The copy online is read-only but just save a copy and then you have it. I may modify the online one when and if I feel like it.
The red boxes in the screencap are for user inputs. When in doubt, that neon blue font is for user input.


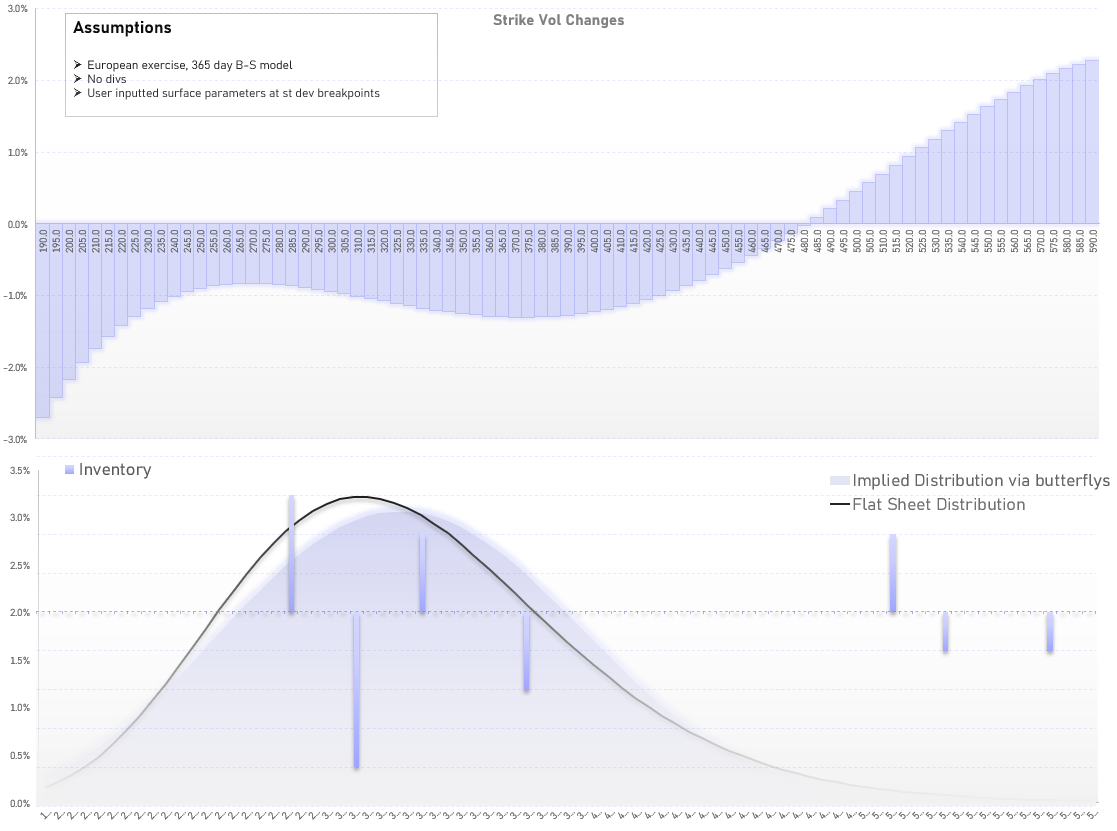
A few charts you’ll find:

If you open the VBA editor you’ll find a bunch of functions and scripts. Some are formulas like vega or Black-Scholes some are scripts that re-scale charts when you double-click them. Some aren’t even used but just kinda useful if you’re into VBA stuff.
I included the second tab called Gamma which I used to give the velocity-acceleration physics intuition to computing gamma p/l. Just something educational, it has no influence on the main Option Chain tab.
Keep in mind, this is not a piece of software. It’s just a spreadsheet that is useful and fun. When I first got into the business I didn’t know how to use Excel. But I had to use it daily in my clerical responsibilities in support of the SPY ETF trading post. Within a month, I asked my boss, the legend Reggie Browne, if it would be ok if I re-wrote the spreadsheet from scratch since I was the one using it all the time while he was in the pit. He said it would be a great use of time because it would improve my nitty-gritty understanding of the ETF but make me more adept at Excel.
I was wizard at Excel within 3 months of joining SIG. I built interactive sheets for the rest of my career (my Parallax front ends behaved like software and were probably overkill but I’m a bit OCD about them). Being so proficient in Excel in the time I was coming up was a small superpower. I was useful to others and more importantly myself because I could spin up tools to test ideas, do simulations, and build monitors without needing to fight for dev resources.
All of this is of course quaint today. Time comes for us all. I was in a high percentile at computers, at least “for a trader”, when I started and now I’m just trying to keep my head above water. But I still think that tinkering is the best way to build intuition outside of actually trading (doing both is best naturally!). And I don’t care if you tinker in Excel or an actual coding language, but tinker.
To that end, I hope this sheet helps.
And if you want a simple idea to tinker with, try the following exercise:
Set the parameters for a vol curve in the sheet. Mess around with it a bit to see the curve change shape. When you’re comfortable move on to step 2.
Keeping the ATM vol fixed, just change the -1 standard deviation put skew so it pushes the vol at that strike up a full point. So for example, if the ATF vol is 50% and the -1 st dev put is 54%, raise the skew until the put at that strike is 55%.
See how the ATF / -1 st dev put spread value changes. You could have guess from looking at the vega on the -1 st dev put but just prove it to yourself. But this is bridging the abstract idea of “skew is increasing” to how does the put spread change in value. Also note how the corresponding call spread on the same strike changes in value. What do you notice?
Observe how the implied distribution chart changes. Hell, jack the put skew up to a ridiculous level, what happens to the upside of the distribution? Would you have guessed that?
There’s no substitute for getting your hands dirty. I won’t explain how everything works here but you can trace the formulas thru the cells. That’s how you learn.
It’s guaranteed that scaling stuff will fail in some way. There’s minimal error-handling in the sheet. It’s not a sheet I have used day in and day out so, it’s a week old. So if something breaks figure out how to fix it. The LLMs are amazing at Excel. Give it a screenshot and ask it how to make the sheet do what you want. It’s so much easier to learn today.
Come to think of it, that goes for options too. That video is called years worth of education in 90 minutes. It’s free. Eggs and toilet paper might be roofed, but when it comes to learning stuff, moontower got you. Like costco hot dogs for option knowledge.
On that note, the spreadsheet is behind the paywall. womp womp.
