Flash post on GLD vol
quick thoughts as I was toggling thru moontower.ai
Friends,
Excuse the flash post but I just wanted to show you a few charts about GLD vol after it popped higher on Friday’s >2% rally in gold.
Gold has been rising with softer dollar and lower rate expectations. Both of our presidential candidates have highly inflationary ideas (Trump wants to replace income taxes with tariffs, Kamala likes both price controls and home-buying subsidies).
At the moment, it doesn’t matter how likely or unlikely their ideas approach anything close to policy…gold is acting as insurance for candidates that have no concept of fiscal restraint. When it comes to protective trades (ie fear trades) it’s always shoot first, ask questions later.
This is setting up premium vol pricing in GLD.
Using moontower.ai we can see what I’m talking about relative to its own history and relatively.
Looking at the Dashboard, GLD 30d IV is in the 98th percentile (1 year lookback)
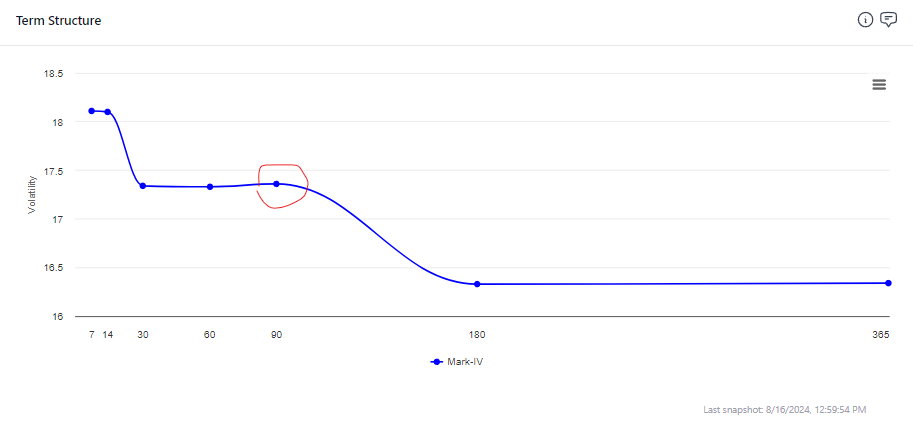
(it’s 1 month-6 month vol term structure is descending which is what you would expect when vol is elevated)
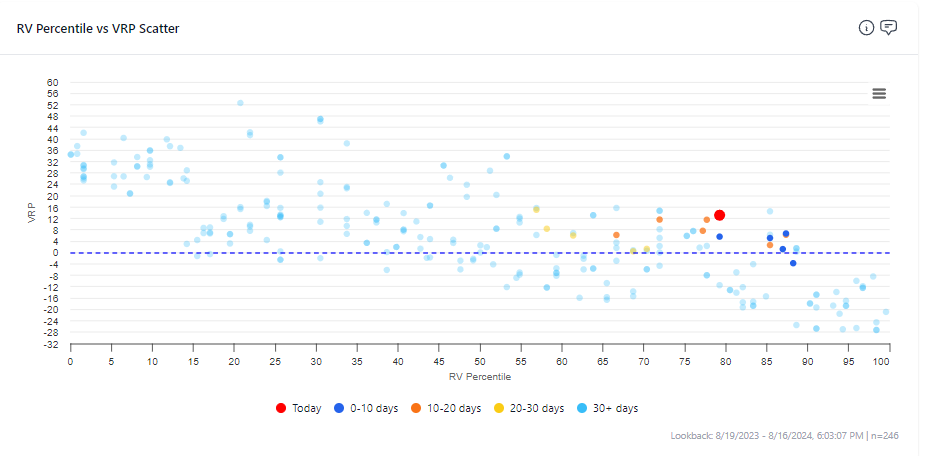
How’s vol carrying lately for 30d options…
The VRP or volatility risk premium is higher than most liquid names (more than 1 st dev from avg VRPs). This is using 1 month IV vs 1 month RV. Friday’s single day move is a 35% annualized vol, so the VRP would be overstated if you shrink the realized vol lookback period. But this is almost always true when VRPs get screen especially large (IV’s are forward looking and therefore weight recent moves more).
We should look closer.
The Dashboard compared the term slope between 1 month and 6 month IV. The drilldown Tickers page gives us more granular views.
But when we look at the term structure the 90d IV stands out as being relatively fat.
Not too surprising since it captures the election and I suspect based on vibes that Kamala is more bullish for gold than Trump.
If you think gold prices have a binary dependance on the election, you can use the November GLD straddle and the prediction markets to back into how much gold might rally if Kamala wins. Use the binary straddle calculator!
The 3-month IV is implying a higher vol than has been realized by any historical vol over any 3-month period in the last 3 years:
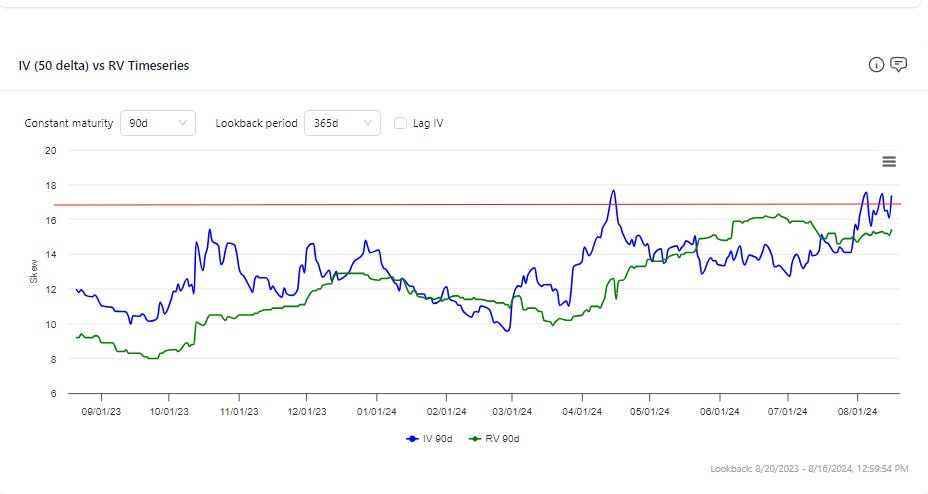
The VRP is also fat considering how high the realized vol already is!
Here’s 3-month IV charted vs 3-month realized vol for the past year (all rolling so this overlapping data — a year of data is small sample but with the vol cone we already saw that even on 3 years of data, years that still included craziness, this IV is fat).
This is not a trade recommendation (I neither can nor will do that). I’m only pointing out what catches my attention.
Some relative thinking
Longer term bonds should also inherit the volatility of inflationary policy (there’s probably a more involved chess discussion of YCC that would defang my statement but we’re looking at 3 month options).
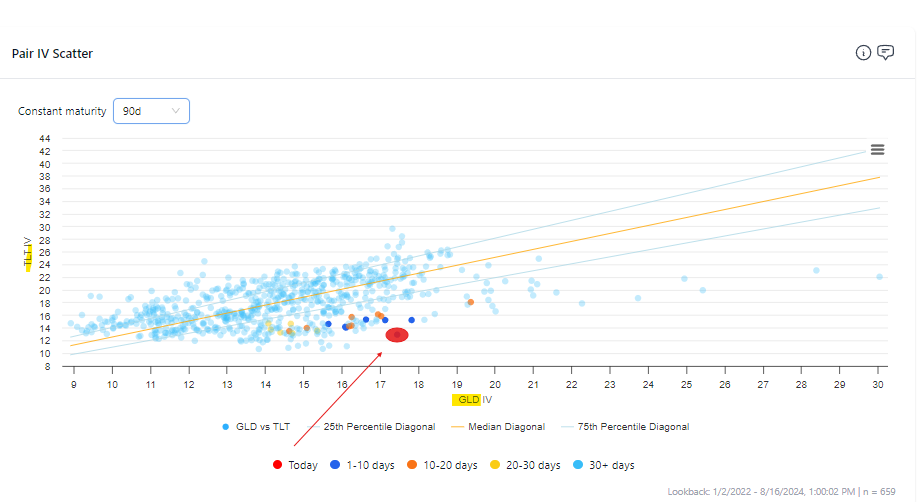
This is a scatterplot of TLT 3 month vol vs GLD 3 month vol over the past year:
For that dot to start walking to a more central part of the cloud either GLD vol needs to fall, or TLT vol needs to increase. There’s a caveat in that you can see that the ratio has had a skew where the GLD vol can become much higher than TLT vol (those dots all the way to the right show that the ratio has touched almost 2, driven by GLD vol being high as opposed to TLT vol being low).
TLT vols was actually down on Friday on an absolute basis and way down relative to GLD. On the Dashboard chart above you can see that 1-month TLT vol is in the 23rd percentile. These are more charts of the 1 month TLT vols:
In a professional vol trading framework, I’d be using the daily changes in strike vols to guide me as I legged into buying TLT vol where it’s cheapest and selling GLD vol where it’s fattest on their relative term structures.
The book would be piling up relative vol exposures, forward vol exposures (if I’m buying say 1 month TLT to sell 3 month GLD), and as the spot price in each scatter, relative skew exposures. Vol trading is a big ball of fur.
But if you have a directional needs or views on TLT or GLD already, you can pick and choose the legs you like a la carte.
Again, I’m not making recs but I thought this was a glaring example of how a vol lens can augment your trade expressions.
Enjoy the rest of your Sunday!
☮️


Thanks for the post kris....
If one choses to put on a pair trade, long TLT and short gold. How does one go about hedging here, should both trades be considered individually and hedge accordingly or some other math way?