Connecting Vol Surfaces To Option P/L
Delta-neutrality, sticky strike vs sticky delta and more...
Friends,
The small cap leg of the rotation in mid-July can be seen in IWM.
I cherry-picked points before the move and at a peak.
In 4 business days, July 10th to July 16th, IWM rallied >10%
The vol surface for the 6-month option expiry (Jan 2025) had a near parallel shift higher.
That’s a substantial move in a 6-month surface but considering ATM vol was 18.8% before the move, a 10% rally in 4 trading days is 4 standard deviation event. Some breathlessness in the surface seems reasonable.
💡To compute how far that move is plug and chug into this equation:
In this post, we will use these vol curves to compute returns on various options. We’ll use a mix of socratic method and simply making observations to get you in comfortable. This is a set-up for upcoming posts that will go deeper into dynamically hedged option p/ls and option p/l attribution.
We don’t have to go into anything more than arithmetic to cover a lot of ground and understanding.
The pre-work for this post was to use a European-style option calculator with these vol surfaces and assume 0 RFR and divs. These simplifications have no material impact on the intuition we’re building.
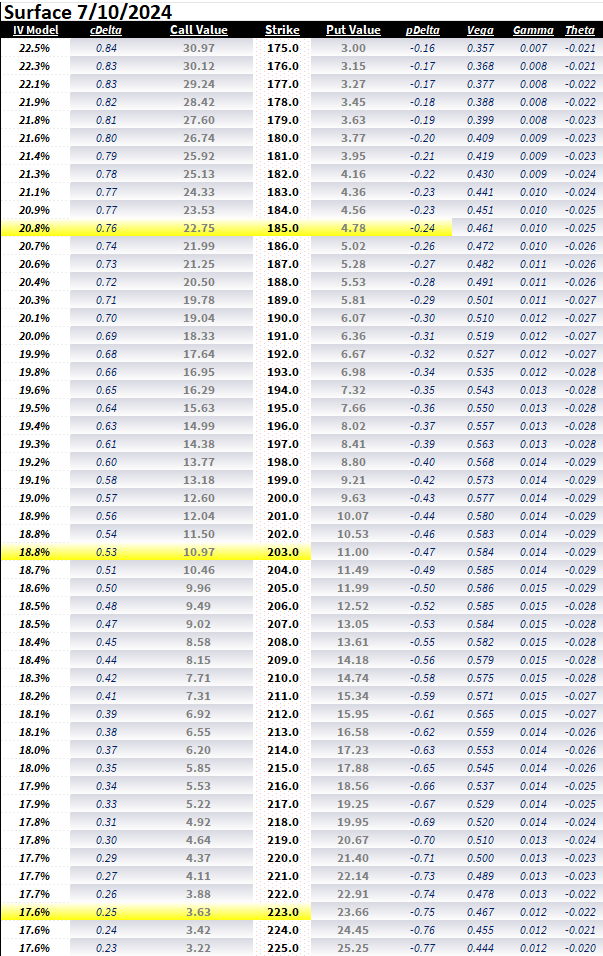
Sample of what this looks like on 7/10/24 with the IWM surface snapshotted with the stock at $202.97
We will focus on:
~.75d call (.25d put)
ATM call (~.53d — do you remember why ATM options have deltas > .50?)
~.25d call
Onwards…


