


2025...back in the groove
Moontower #253

Friends,
Happy New Year all. There are a lot of new subs which seems perverse since I haven’t posted in a couple weeks but I suspect the “don’t post and grow” strategy has its limits :-)
It’s a convenient juncture to refresh the administrative aspects of the moontower playground.
First, about the substack:
Calendar
Moontower is published 3x per week.
Sunday: The OG letter now is almost 6 years old. The top section can be about anything while the Money Angle and Money Angle For Masochists section are for investors and traders respectively. Sometimes I throw in From My Actual Life which is what it sounds like — personal stories.
Wednesday Munchies: I share what I learned from something I read, watched, or listened to. Can be any topic.
Thursday Paywall: This tends to be more niche but of practical value to traders. I’d also use these to cover stuff I feel more comfortable discussing with a tighter audience.
These are guidelines. When you get down to it, I have an editorial queue but I go off-script all the time as topics spontaneously capture my attention.
Collaboration
For sponsors: The letter occasionally gets sponsored. I don’t advertise that this is possible, it happens by reverse inquiry but you can interpret the next few sentences as my advertising. The readership of this letter is a delightful mix of smart learners/strivers, wildly successful and influential hitters mostly in finance and tech, and parents. Since I have an 8 and 11-year-old, parenting topics have a lot of my mindshare and spill into the letter. Outside of the trading stuff, it is the most engaged segment of my inbound and that makes sense — none of us got an instruction manual to kids, but it’s like we all have parts of the map. There’s a lot to gain from comparing notes or hell just spewing exhaust (the double-entendre of that word in this context is absolutely intended).
If you want to sponsor the letter, reach out.
For people who want to guest post: These have been giant win-wins for readers and the authors.
Last year 3 were very popular:
A Visual Primer For Understanding Options by
Moneyballing College Admissions by my good friend Brent
Guest posts often are the result of weeks or even months of collaboration as I will act as both sparring partner and editor (I’m protective of the quality in here and whether I suck at this or not is not for me to decide but I do take whatever standards I have seriously). I don’t think I’m overstepping to say the writers find it fulfilling because they’ll give me the piece thinking it’s near its finished version and only to find that it’s got a long way to go. It’s not a fun process necessarily but one that will stretch your frontier a tad further.
If you want to use moontower as a venue to post let me know. If the idea resonates or if there’s a version that we can mutually agree I’d love to host it. If you have special knowledge but don’t have any distribution this can be a great jumpstart to a new hobby or more.
My other major project, which has turned into a growing business, moontower.ai is “option analytics with a point of view”.
There is a lot of development on the product side but one of the larger upgrades is on the community front — a Moontower Discord launched just a few days ago. This is available to all moontower.ai subs.
Montower.ai has:
thousands of free subs who can access educational content and the Discord)
hundreds of paying subs enabled for analytics, calculators, the chatbot, subscriber-only events, and Discord channel within the broader Discord.
Sign up moontower.ai (free or paid) and find your way to the Discord if interested.]
Finally, I’m working on some trippy moontower merch. Let’s just say it’s stuff that feels amazing to hold in your hands and definitely not typical swag.
Money Angle
The original moontower blog is https://moontowermeta.com/. The “meta” is an important word. Important enough that Facebook stole my language and turned it into their ticker. F’n Zuck. Leave some for the little people bruh.
The reason I used “meta” (besides the fact that moontower.com wasn’t available) was because a lot of things I think about are fairly meta. Knowledge is the object but how we acquire knowledge is the meta. Trading is a very meta discipline because games with counterparties require a solid “theory of mind”.
In the spirit of meta, I really enjoyed a recent post by Robot James titled:
Valuation Timing with Excel (6 min read)
It’s meta because it’s really about arming yourself with data analysis to confront a narrative or chart. It’s worth stepping through the article together to appreciate just how many meta-nuggets it contains.
First, we start with an object-level observation that you’ve likely encountered. I’ll quote freely from the post but all bold is mine:
You may have seen a lot of charts like this recently:

The conclusions people tend to draw from this chart are:
there is an obvious and strong relationship between valuation and expected future returns (cheap = good, expensive = bad)
valuation estimates are currently historically high; therefore, expected returns of the S&P 500 are historically low.
We should always be wary of drawing strong conclusions from stuff people share on the internet or in sell-side research.
There are a few reasons to be skeptical of the strong conclusions people tend to make on seeing this:
the chart might just be wrong (people screw up financial data analysis all the time)
10 years is a really long time horizon
all of the 10-year total returns are actually positive
why are there so many points? How many 10-year periods has the index even existed for?!
The good news is that, with a few simple skills, we don’t have to believe what randos on the internet say.
Even if we can’t write code, we can use Microsoft Excel and free online tools to investigate these things ourselves.
James shows how simple it is to grab the data that would feed such a chart so we can manipulate it ourselves. One of the first manipulations is addressing the fact that such a chart is really derived from an extremely small sample size because each data point is highly overlapping to the others. A rolling 10-year return is comprised of 120 months so each new “sample” overlaps with the prior one by 119/120.
James starts the exploration by looking at monthly returns (instead of 10-year returns) vs CAPE.
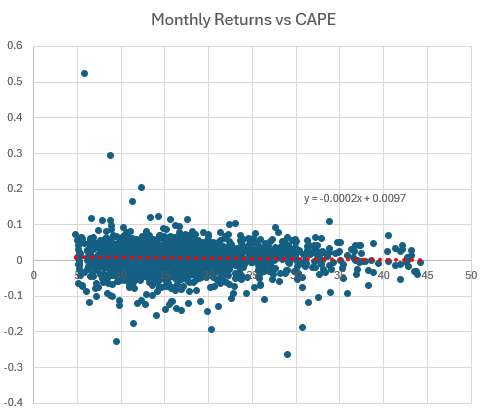
Let’s turn back to James for interpretation.
Unsurprisingly, that looks like a big blob. (Anything with monthly returns on the y-axis will look like a big blob.)
[Kris: that bold statement is a useful bit of knowledge that comes from looking at financial data frequently]
What does James do next?
We can look at longer non-overlapping periods. Let’s keep with the 10-year forward window and look at decades.
The problem is that we now only have 15 observations! Ten years is a long time, and we simply don’t have that many unique non-overlapping ten-year periods. And we certainly don’t have many unique non-overlapping ten-year periods that are similar to the current market structure and competitive environment.
[Kris: that bold bit is an evergreen problem in finance because investing is biology not physics. Markets learn so output become inputs. What does that mean? Markets are more likely to fall AFTER everyone starts believing they can only go up. The “only goes up” is the output or observation that then becomes an input into how much risk investors take. There is always some price that peers back at history and says “not this time”.]
So James slices the data another way.
Plot the valuation metric itself…

whenever we see an effect, we should ask what other than our pet theory might be causing that effect to appear. In particular a lot has changed over that time period. The market looks nothing like what it did in 1900 today.
And, indeed, if we plot a time series of our valuation metric, it looks kinda drifty.
It’s not really reasonable, I don’t think, to assume that CAPE 20 would “mean” the same thing in 2024 as it did in 1900.
He tries another manipulation:
One cheap and dirty way we can make that metric a bit less drifty and more comparable over time is to standardize it by its values over a recent rolling window.
For example, here I’ve standardized it as a 10yr rolling score. (Not necessarily cos I think that’s the right thing to do – I just want to make a point).

Now it looks a lot more stationary. It stays in the same range. It doesn’t drift off. This is unsurprising cos we forced it to look like that.
[Kris: the bold is another lit bit of fingertip knowledge that you acquire from frequent contact with data.]
Yet, another manipulation:

Now, we can plot our next year’s returns vs this standardized z-score.
If we still see an effect when we do this, it would make us more confident in the valuation effect. If we don’t, it won’t destroy our confidence because we’ve made some pretty arbitrary and dubious scaling choices here.
Indeed, at least with this scaling choice, we don’t see the effect we are looking for.
That’s ok. That’s the nature of work like this. We’re just exploring, trying to break things. We try to look at things from as many different angles as we can and see how much of the limited evidence lines up.
[Kris: I just want to pause for beauty as my wife likes to say. James is spoon-feeding serum against chart crimes and charlatans who read “How To Lie With Statistics” as a manual].
James’ Conclusion
I think the evidence (and economic sense) supports the idea that high valuations are correlated with lower expected returns. But it’s nowhere near as clear-cut as the initial scatterplot suggests. We simply don’t have enough data, and the market is constantly changing underneath us, making it hard for us to draw strong inferences.
My conclusion
This points to an uncomfortable reality. If a data analysis was conclusive then everyone would do the thing prescribed until the data exhaust from the behavior was no longer conclusive. This is deeply reminiscent of what I call the Paradox of Provable Alpha.
Notice what James did.
He recognized that the data proves nothing but it’s simply too underpowered to accept or reject any claims. His prior barely gets updated: “I think the evidence (and economic sense) supports the idea that high valuations are correlated with lower expected returns.”
He goes to bed at night with judgment as his best guess much like a farmer’s almanac will do better at predicting the weather in a month vs some meteorological model.
Money Angle For Masochists
2 links
🔗Lifetime Achievement Award: Don Wilson (27 min read)
I stood next to several DRW traders when I was on the NYMEX. They were formidable in nat gas options especially the back end of the curve. Risk magazine profiles their founder whose generally difficult to find out about. Most prop firm founders somehow manage to keep a low profile despite their extreme wealth. (Meanwhile Bill Ackman and Ray Dalio want everyone to look at them. I guess I’m “just asking questions”)
🧵I got asked what my best and worst trades were (Twitter)
From My Actual Life
Holiday hibernation always leads to game recs.
🎲Left Center Right (1 min video)
This game is pure degeneracy and takes less than a minute to learn. Asian grandmas and 5-year-olds alike will lose their minds over it. Huge party hit this holidays. It’s actually an old game, but new to me. It has zero skill so when I heard how it works I immediately poo poo’d it but playing it in a group of 15 for a little cash is amazing.
If you want to make it skillful just create an open outcry side-market on who the winner is. Let’s say “Ann” is playing…Ann futures settle to 0 or 100 depending on if Ann wins so you can bid, offer, or trade any integer price between 0 and 100 based on your assessed probability of Ann winning. It’s a faithful simulation of mock trading (and really similar to the StockSlam game I was playing a couple years ago).
Related posts:
💻Turing Machine (link)
This deduction game offers a unique experience of questioning a proto-computer that works without electricity or any sort of technology. (It uses punchcards!)
The Goal? Find the secret code before the other players, by cleverly questioning the machine.
This game is impressive. With 95 punchcards and 48 “verification” circuits (these are the logic gates you use to test your hypotheses against) they generate over 7 million problems! After one round you are just sitting there wondering how big-brain the designers are.
You can play competitively, solo, or coop. The game is beautiful and stimulates that part of your brain that’s trying to nail the logic for a complicated array formula in Excel. The game says 14+ but I’d say it’s fine for any middle-schooler that likes games.
Zak taught me how to play and then cooked me.

Stay Groovy
☮️
Need help analyzing a business, investment or career decision?
Book a call with me.
It's $500 for 60 minutes. Let's work through your problem together. If you're not satisfied, you get a refund.
Let me know what you want to discuss and I’ll give you a straight answer on whether I can be helpful before we chat.
I started doing these in early 2022 by accident via inbound inquiries from readers. So I hung out a shingle through the Substack Meetings beta. You can see how I’ve helped others:
Moontower On The Web
📡All Moontower Meta Blog Posts
👤About Me
Specific Moontower Projects
🧀MoontowerMoney
👽MoontowerQuant
🌟Affirmations and North Stars
🧠Moontower Brain-Plug In
Curations
✒️Moontower’s Favorite Posts By Others
🔖Guides To Reading I Enjoyed
🛋️Investment Blogs I Read
📚Book Ideas for Kids
Fun
🎙️Moontower Music
🍸Moontower Cocktails
🎲Moontower Boardgaming
Game list via fat fire Reddit for when you’re browsing https://www.reddit.com/r/fatFIRE/s/w5SL3Yf5Md
Robot James is great, thanks for highlighting this. Ed Easterling over at Crestmont Research has done a lot of good work on this topic without the typical chart crimes and math errors that you find elsewhere