


Breakpoints

Friends,
I caught David Boole’s segment about GME on CNBC because it was on Twitter. David used to cover me back when I showered every day. I agree with all of the framing.
He mentioned that the call skew in GME was higher this time around then back in early 2021. This made me want to look up the data but also prompted me to measure skew differently. But the “how to measure implied skew” question was a ball bouncing in my head already.
After publishing Scatterplot Gallery, Dave (not David Boole but an options market-maker) responded:
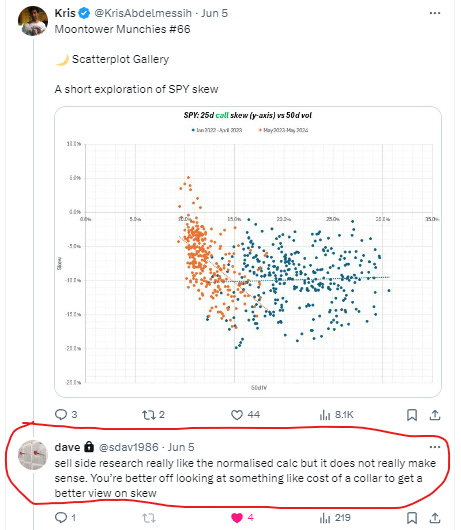
Dave is right. Sell side research likes normalized skew as a measure. So do I. We use it in moontower.ai. It’s how I looked at skew during my days at the fund and it’s the parameter I used at the spline points for my vol surfaces. I built up an intuition for those ratios over time per name. It’s also easy to compute.
Normalized skew is simple ratio of the volatility at an out-of-the-money point on the curve to the at-the-money volatility. It is common to measure at skew at the 25 and 10 delta strikes both on the upside and downside of the volatility surface and use the 50 delta option to normalize. (note the 50d strike is often but not always the at-the-money strike).
For example, assume:
Strike: 50 delta, IV: 28%
Strike: 25 delta put, IV: 32%
Normalized skew = OTM volatility/ ATM volatility - 1
Normalized skew = 32%/28% - 1 = 14.3%
The 25d put is trading at a 14% premium to the ATM volatility.
But…
Dave is CORRECT.
The measure doesn’t really make sense. It’s useful because it normalizes skew to ATM vol, but the measure often has a non-linear relationship itself to the vol. OTM options are sticky at the extremes of vol — so normalized skew flattens when vol gets high and steepens when it gets very low. So if you wanted to know if skew is “high” or “low” you still might want to condition it on vol level. Which of course, negates some of the benefit of normalizing it in the first place.
In general, it’s safe to use because it will correlate strongly with alternative measures of skew — it still captures “high” or “low”.
But unless you are a vol trader accustomed to how that parameter maps to prices because you see it in a model every day next to option premiums, it’s abstract.
Measuring surface and skew changes is a big topic in setting vol surfaces (or sheets if you’re “book a colonoscopy years old”).
Today, we’ll discuss skew models which will serve as background for next week’s paid post where we:
look at another measure of skew in the spirit of Dave’s comment
apply it to GME and David Boole’s comment
For both posts, we will be visual and lean towards simple.